
Your Stack Overflow Graphs Prove Nothing

Every few months someone posts a chart of the number of questions being posted to Stack Overflow and draws conclusions about AI.
The conclusions are possibly right, but the argument does not prove, or even support them.
Why? Nearly every online community over the last few years has faced the same pattern. Growth, stagnation, decline. Usually built by technical people who attract other technical people until it gets big enough to attract business people who try to squeeze money out of it, and so the technical people go somewhere else.
Stack Overflow also had a number of other factors that could also explain it's decline:
- Sold to a private equity firm. Prosus acquired Stack Overflow for $1.8 billion in 2021. PE ownership reliably changes the incentives from "keep the community healthy" to "extract revenue from the existing graph."
- The 2023 moderator strike. Stack Exchange moderators staged a public walkout over a poorly-communicated AI content policy. Moderators are the unpaid load-bearing wall of any forum and a strike of that scale signals deep loss of trust.
- Cookie banners and consent walls. Like most large sites, Stack Overflow added GDPR cookie popups and consent prompts that interrupt the first interaction a new visitor has with the site. Friction at the door reliably hurts long-tail community growth.
- Search and SEO changes. Google's Helpful Content updates changed how question-shaped queries get routed. A lot of the answer is now read on the search results page itself.
Below are nine other communities that had their own moments and then collapsed. None of them were killed by AI but the graph shapes look very similar.
Friendster
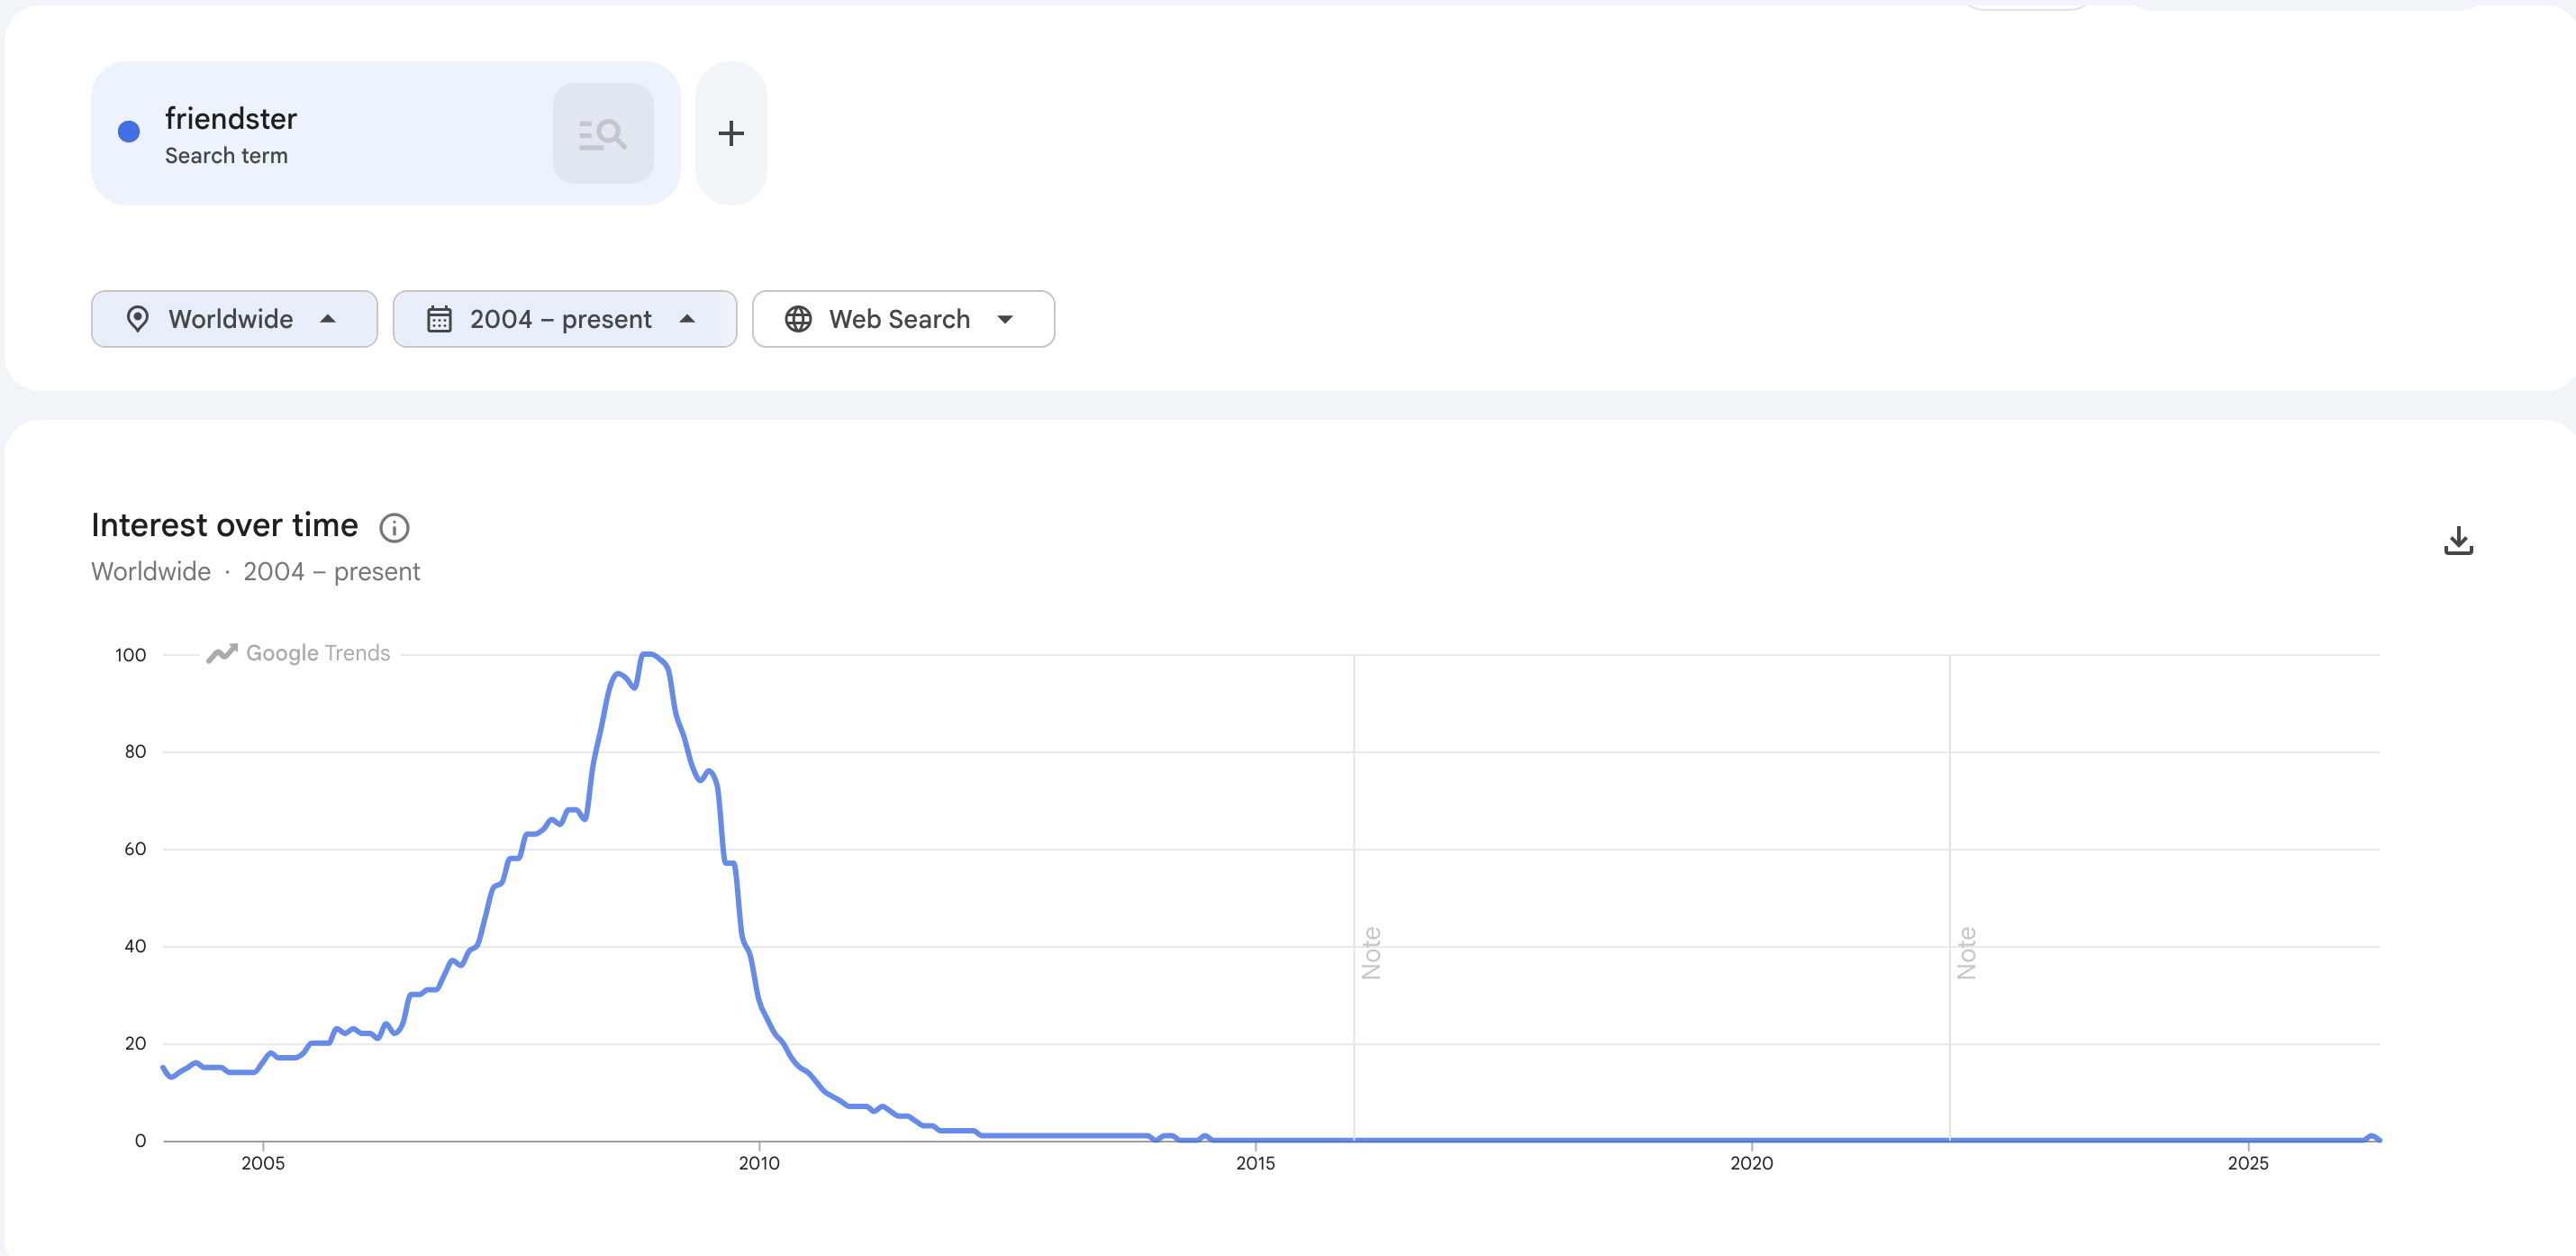
The original mainstream social network. Peaked in late 2008/early 2009, lost its userbase to MySpace and then Facebook, and was effectively dead as a social network by 2011 — it tried to pivot to gaming and shut the social site down for good in 2015.
MySpace
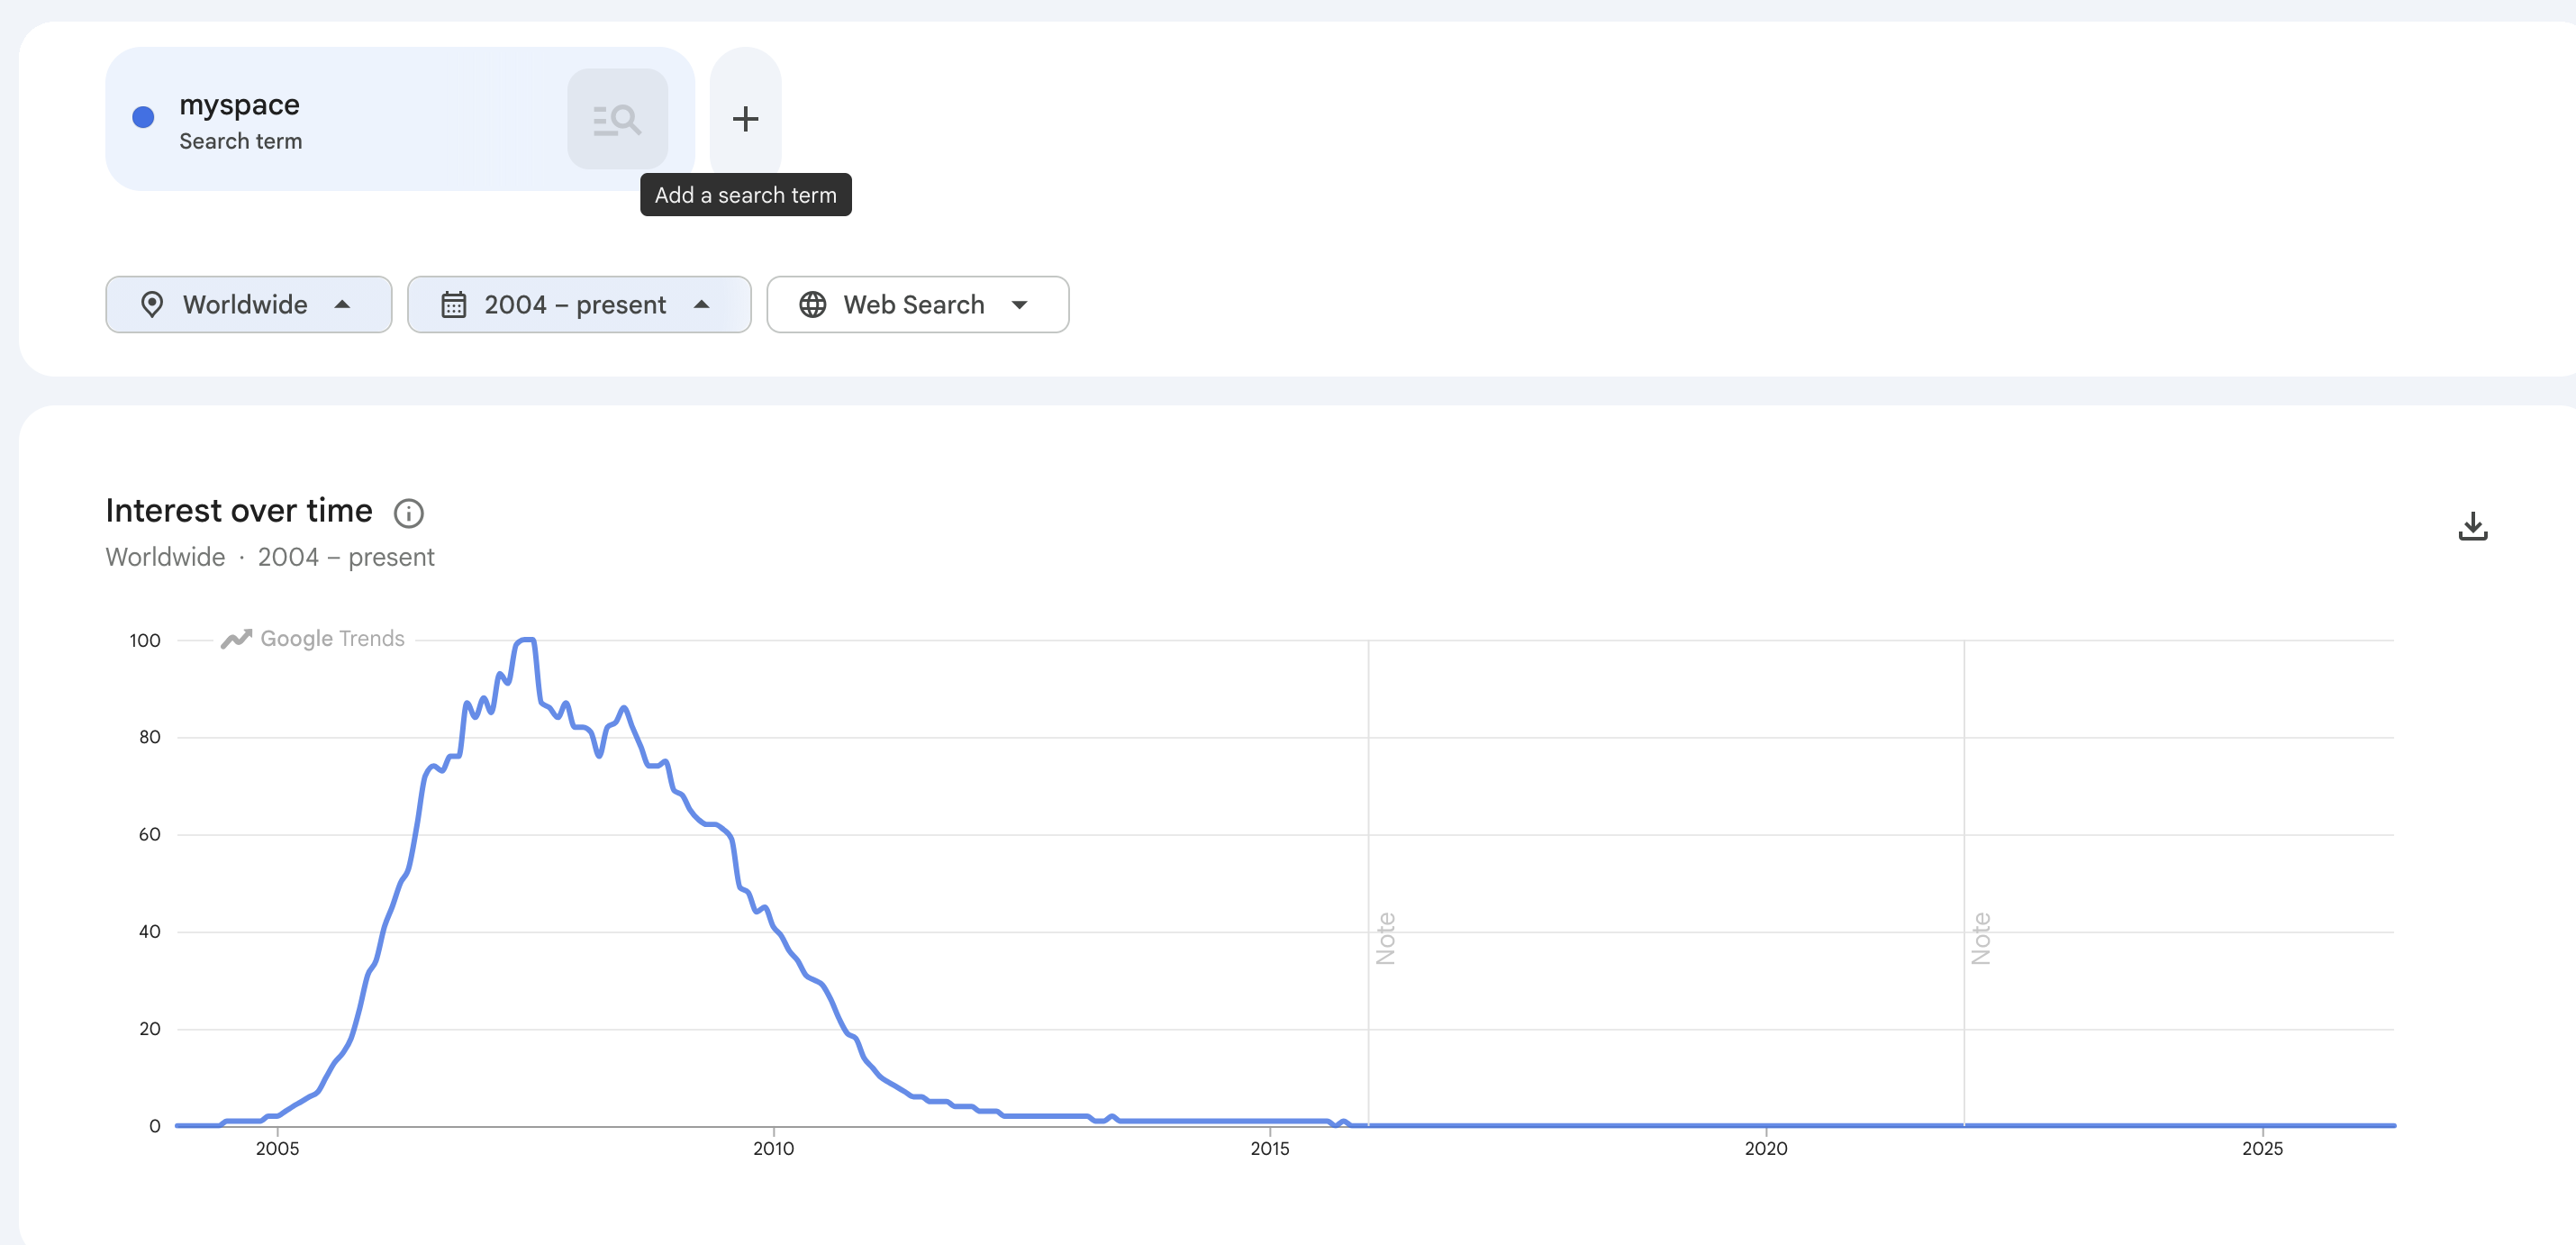
The defining social network of the late 2000s, where every band had a page and every user customised their profile with broken HTML. Peaked in early 2009 and was effectively done by late 2012 once Facebook had won the network-effects fight.
Bebo
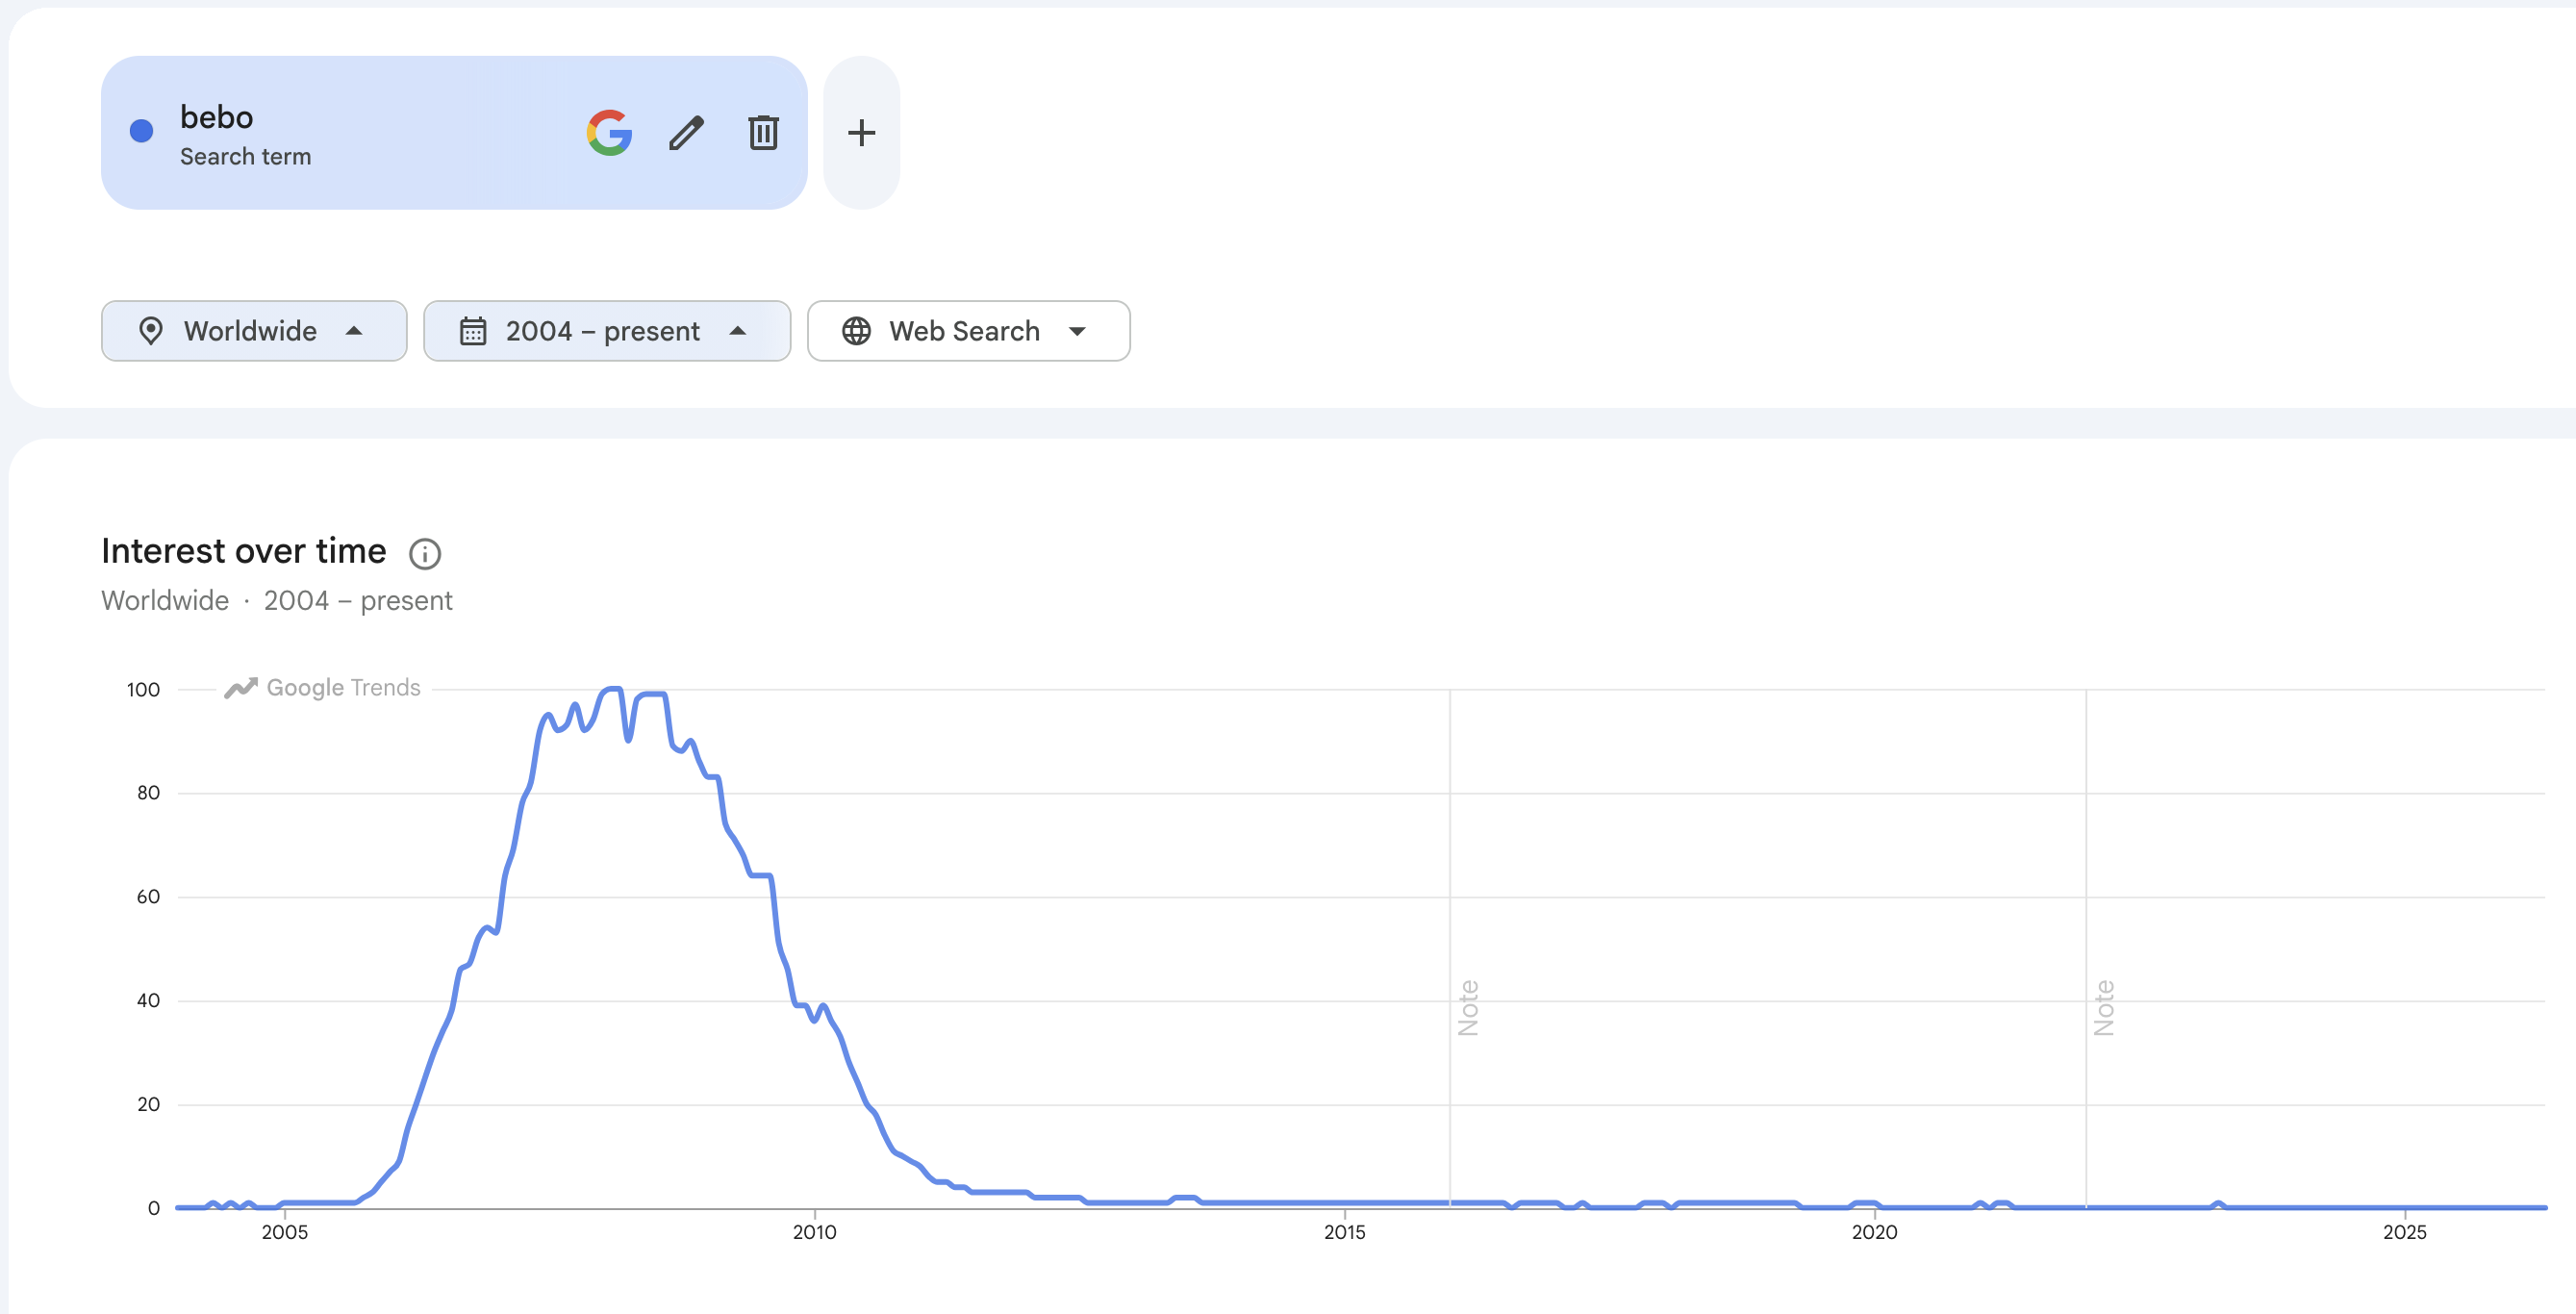
Huge in the UK, Ireland and New Zealand among teenagers. Peaked between 2007 and early 2009, AOL acquired it at the top for $850M, and by 2012 it was bankrupt and the original community was gone.
Orkut
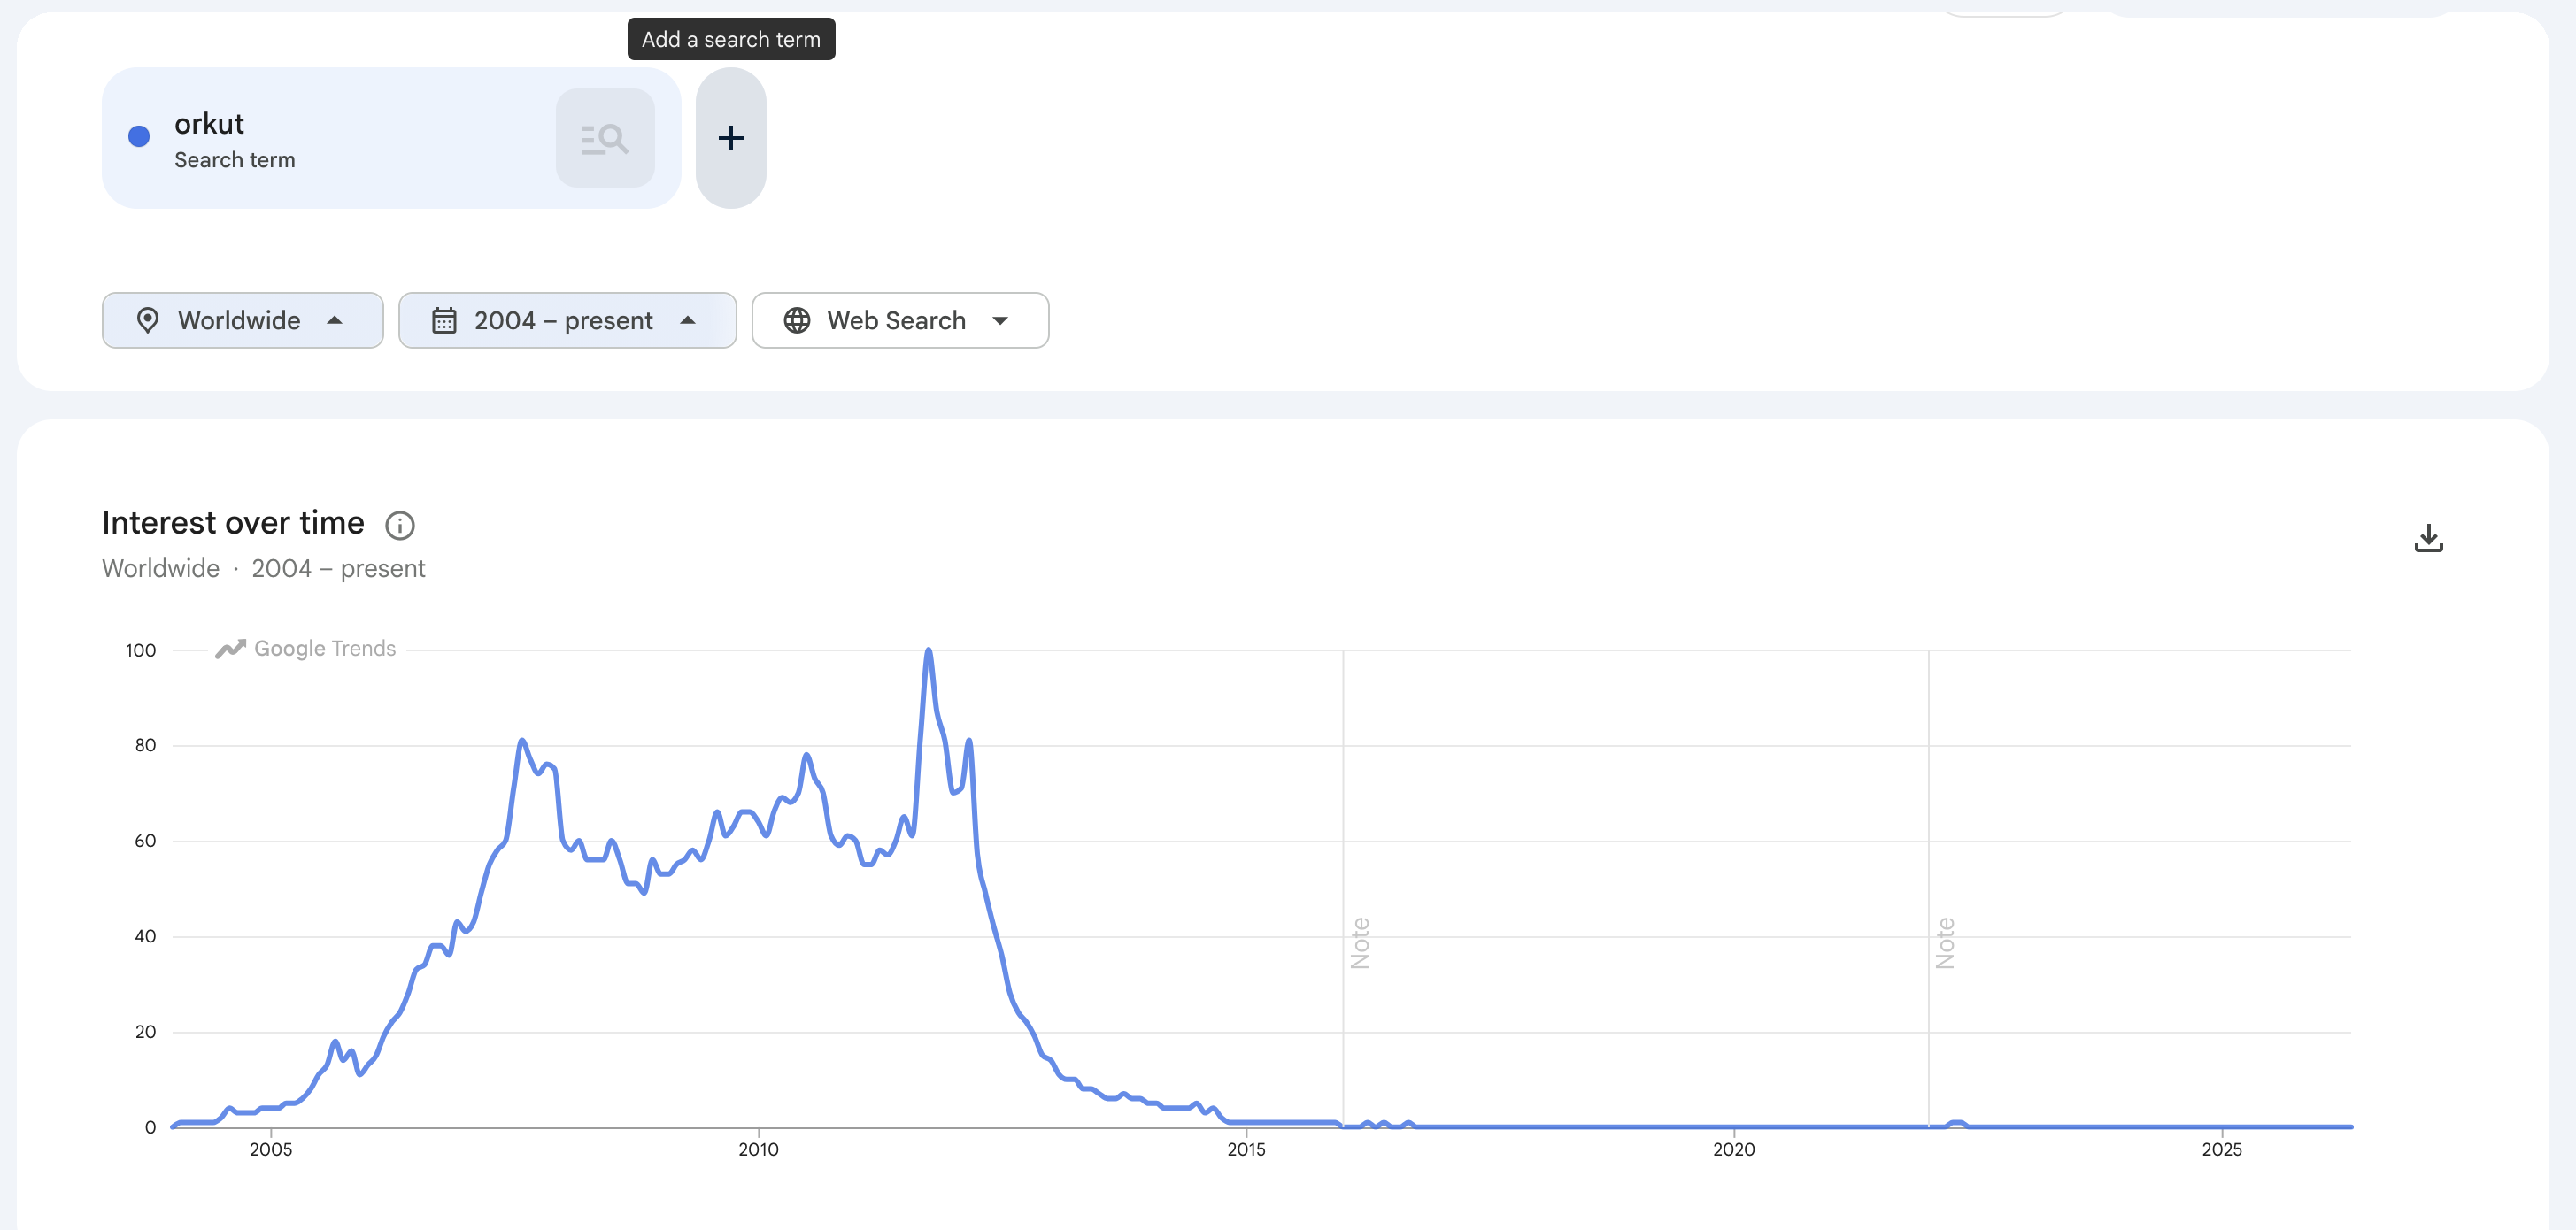
Google's own social network, which became dominant in Brazil and India. Peaked in late 2011 / early 2012 and was at zero by 2015 — Google shut it down in 2014.
Digg
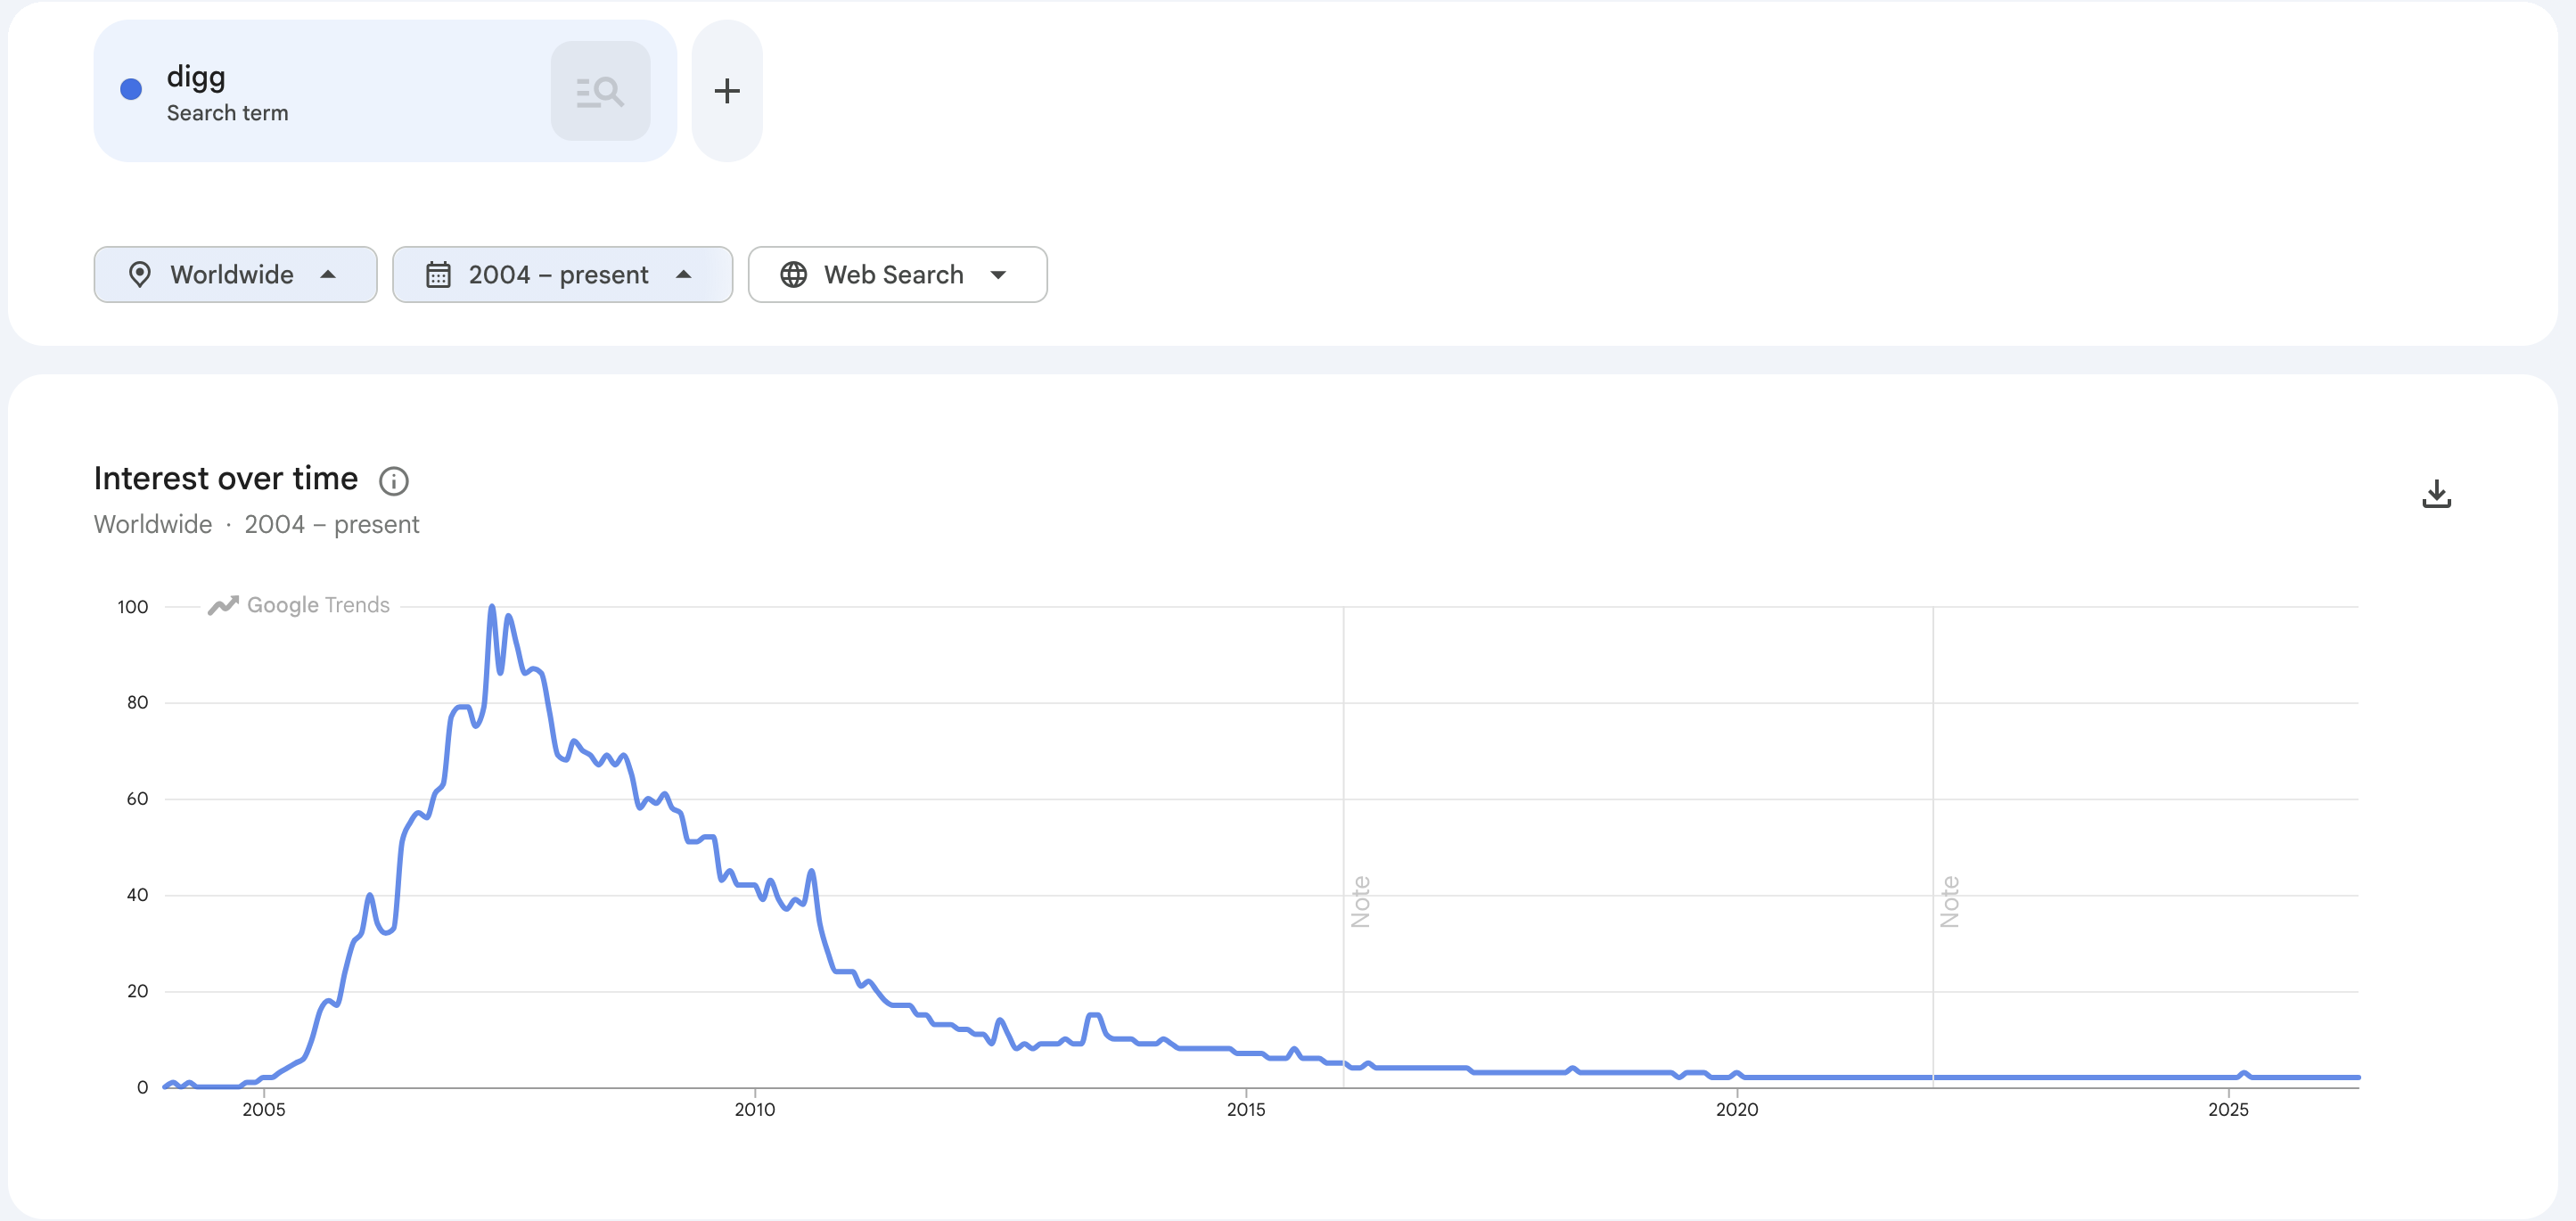
The original "social news" front page of the internet. Peaked late 2007 / early 2008. A botched 2010 redesign (the famous "v4") drove the core community to Reddit overnight, and Digg has been near-zero ever since.
Yahoo Answers
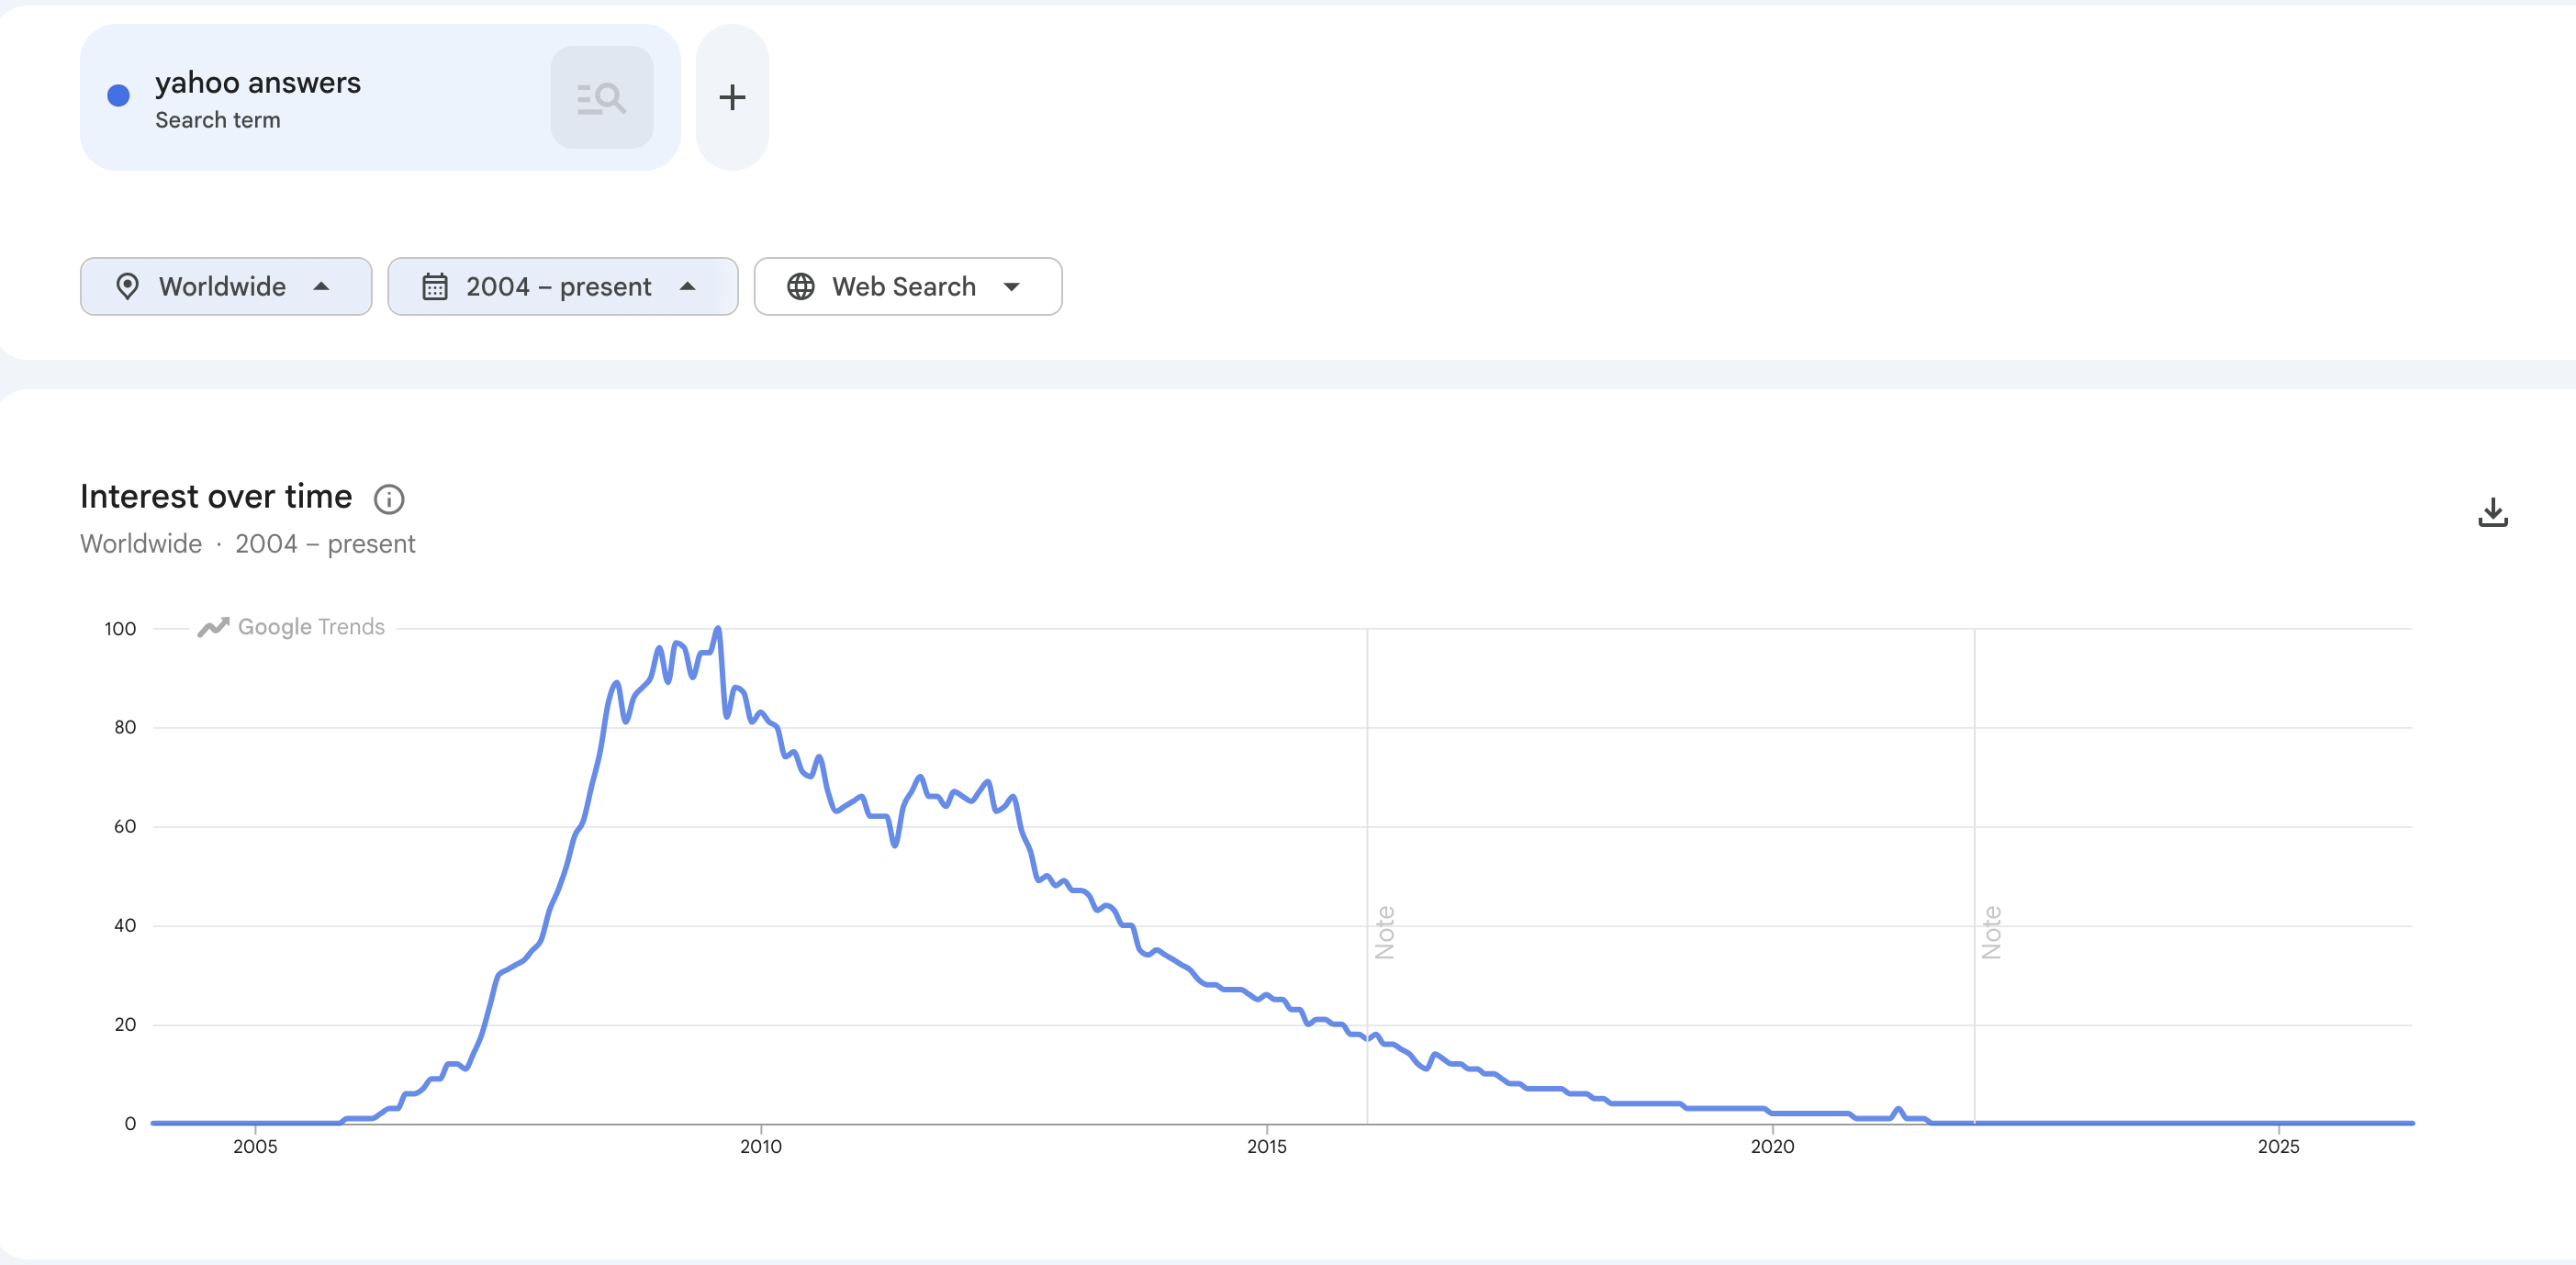
A mass-market Q&A site that hit its stride in late 2009. It declined steadily through the 2010s as the asker pool shifted to Quora, Reddit and Google, and Yahoo shut it down entirely in May 2021.
ask.fm
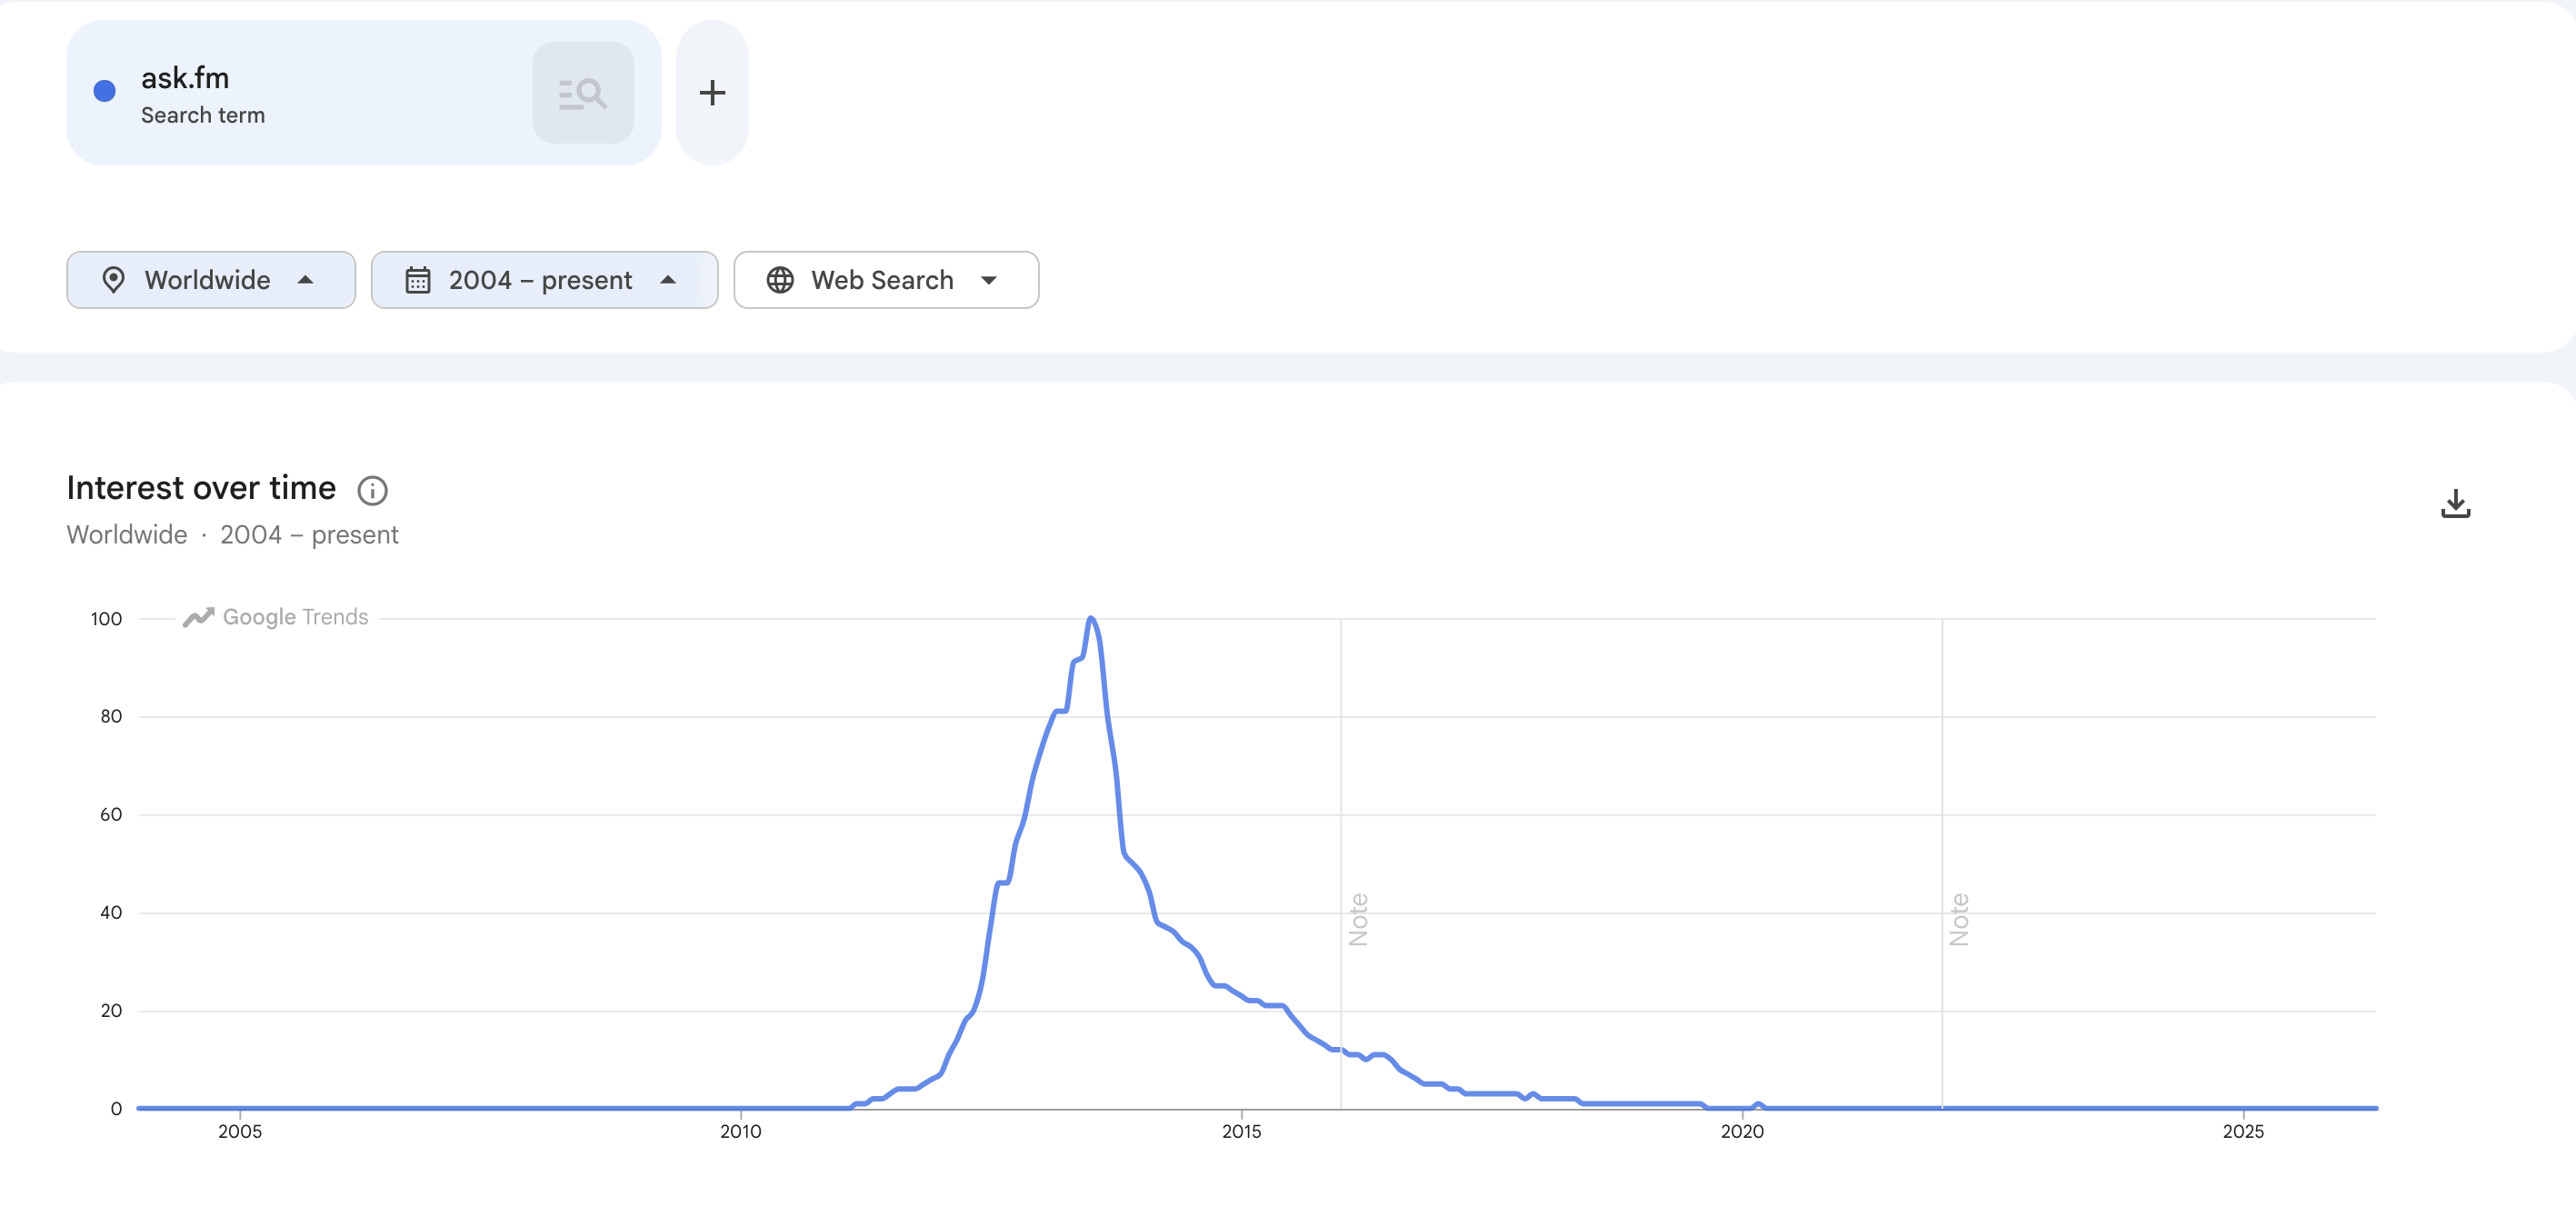
The anonymous-question social site that became a teen phenomenon. Peaked in mid-2013, then suffered a sharp decline driven partly by safety scandals and partly by the userbase moving to Snapchat and Instagram. Near-zero by 2017.
Tumblr
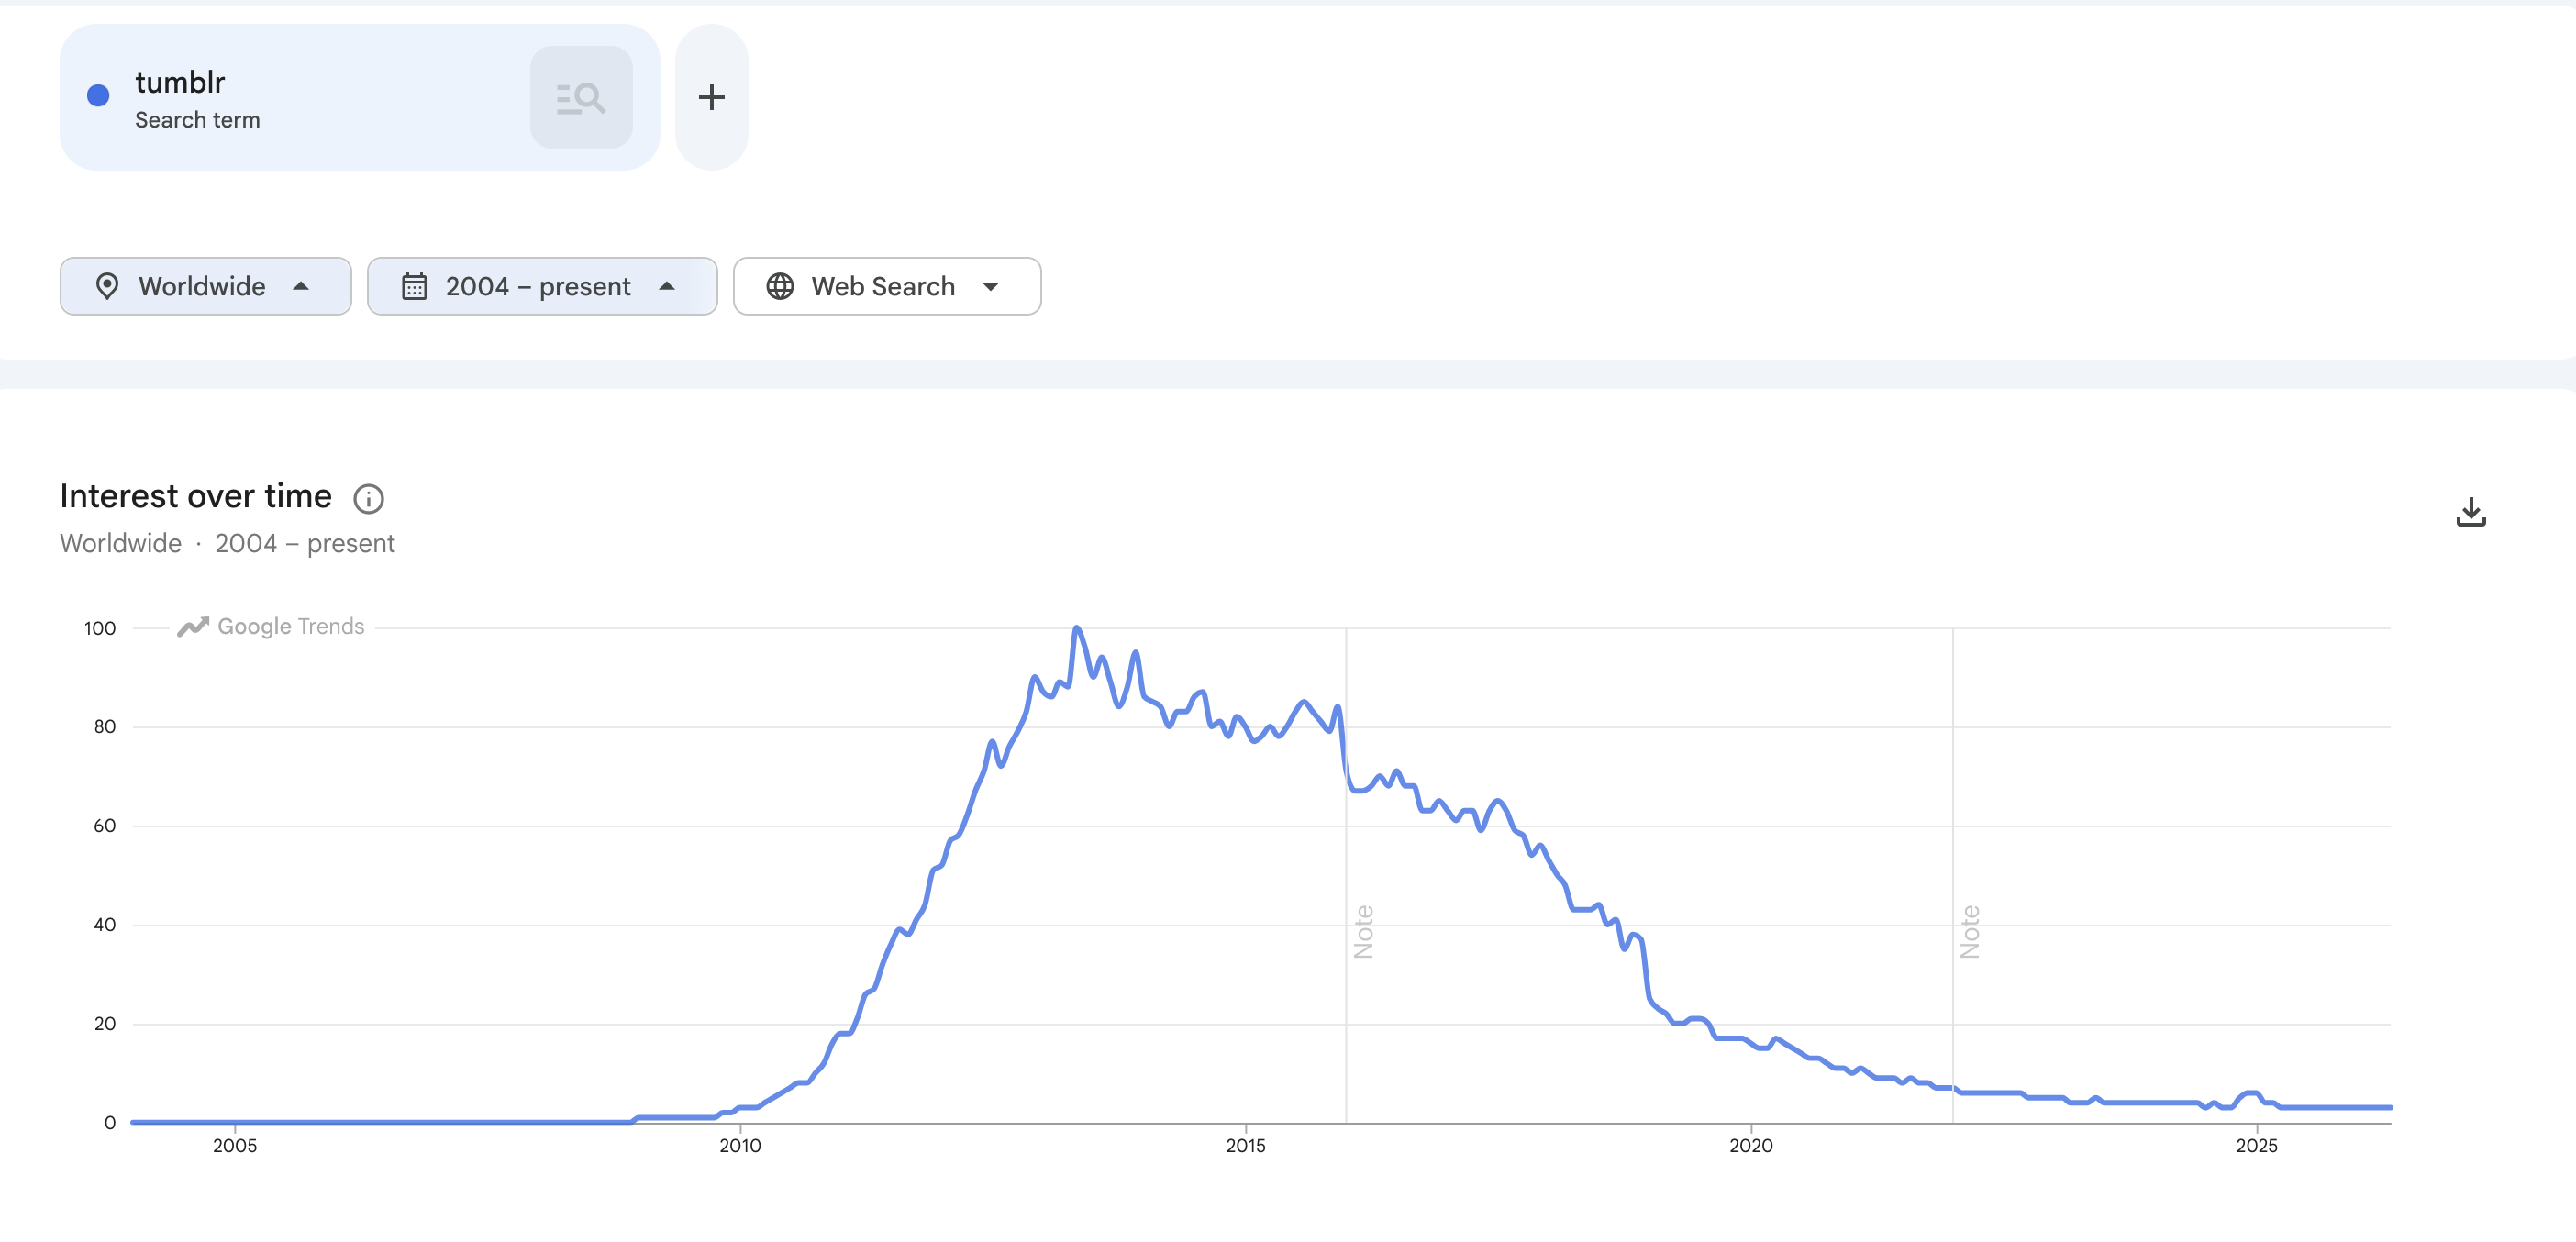
Peaked in early 2013 around the Yahoo acquisition. The 2018 adult-content ban triggered the famous collapse, and by 2022 the site was running at a tiny fraction of its peak interest.
Quora
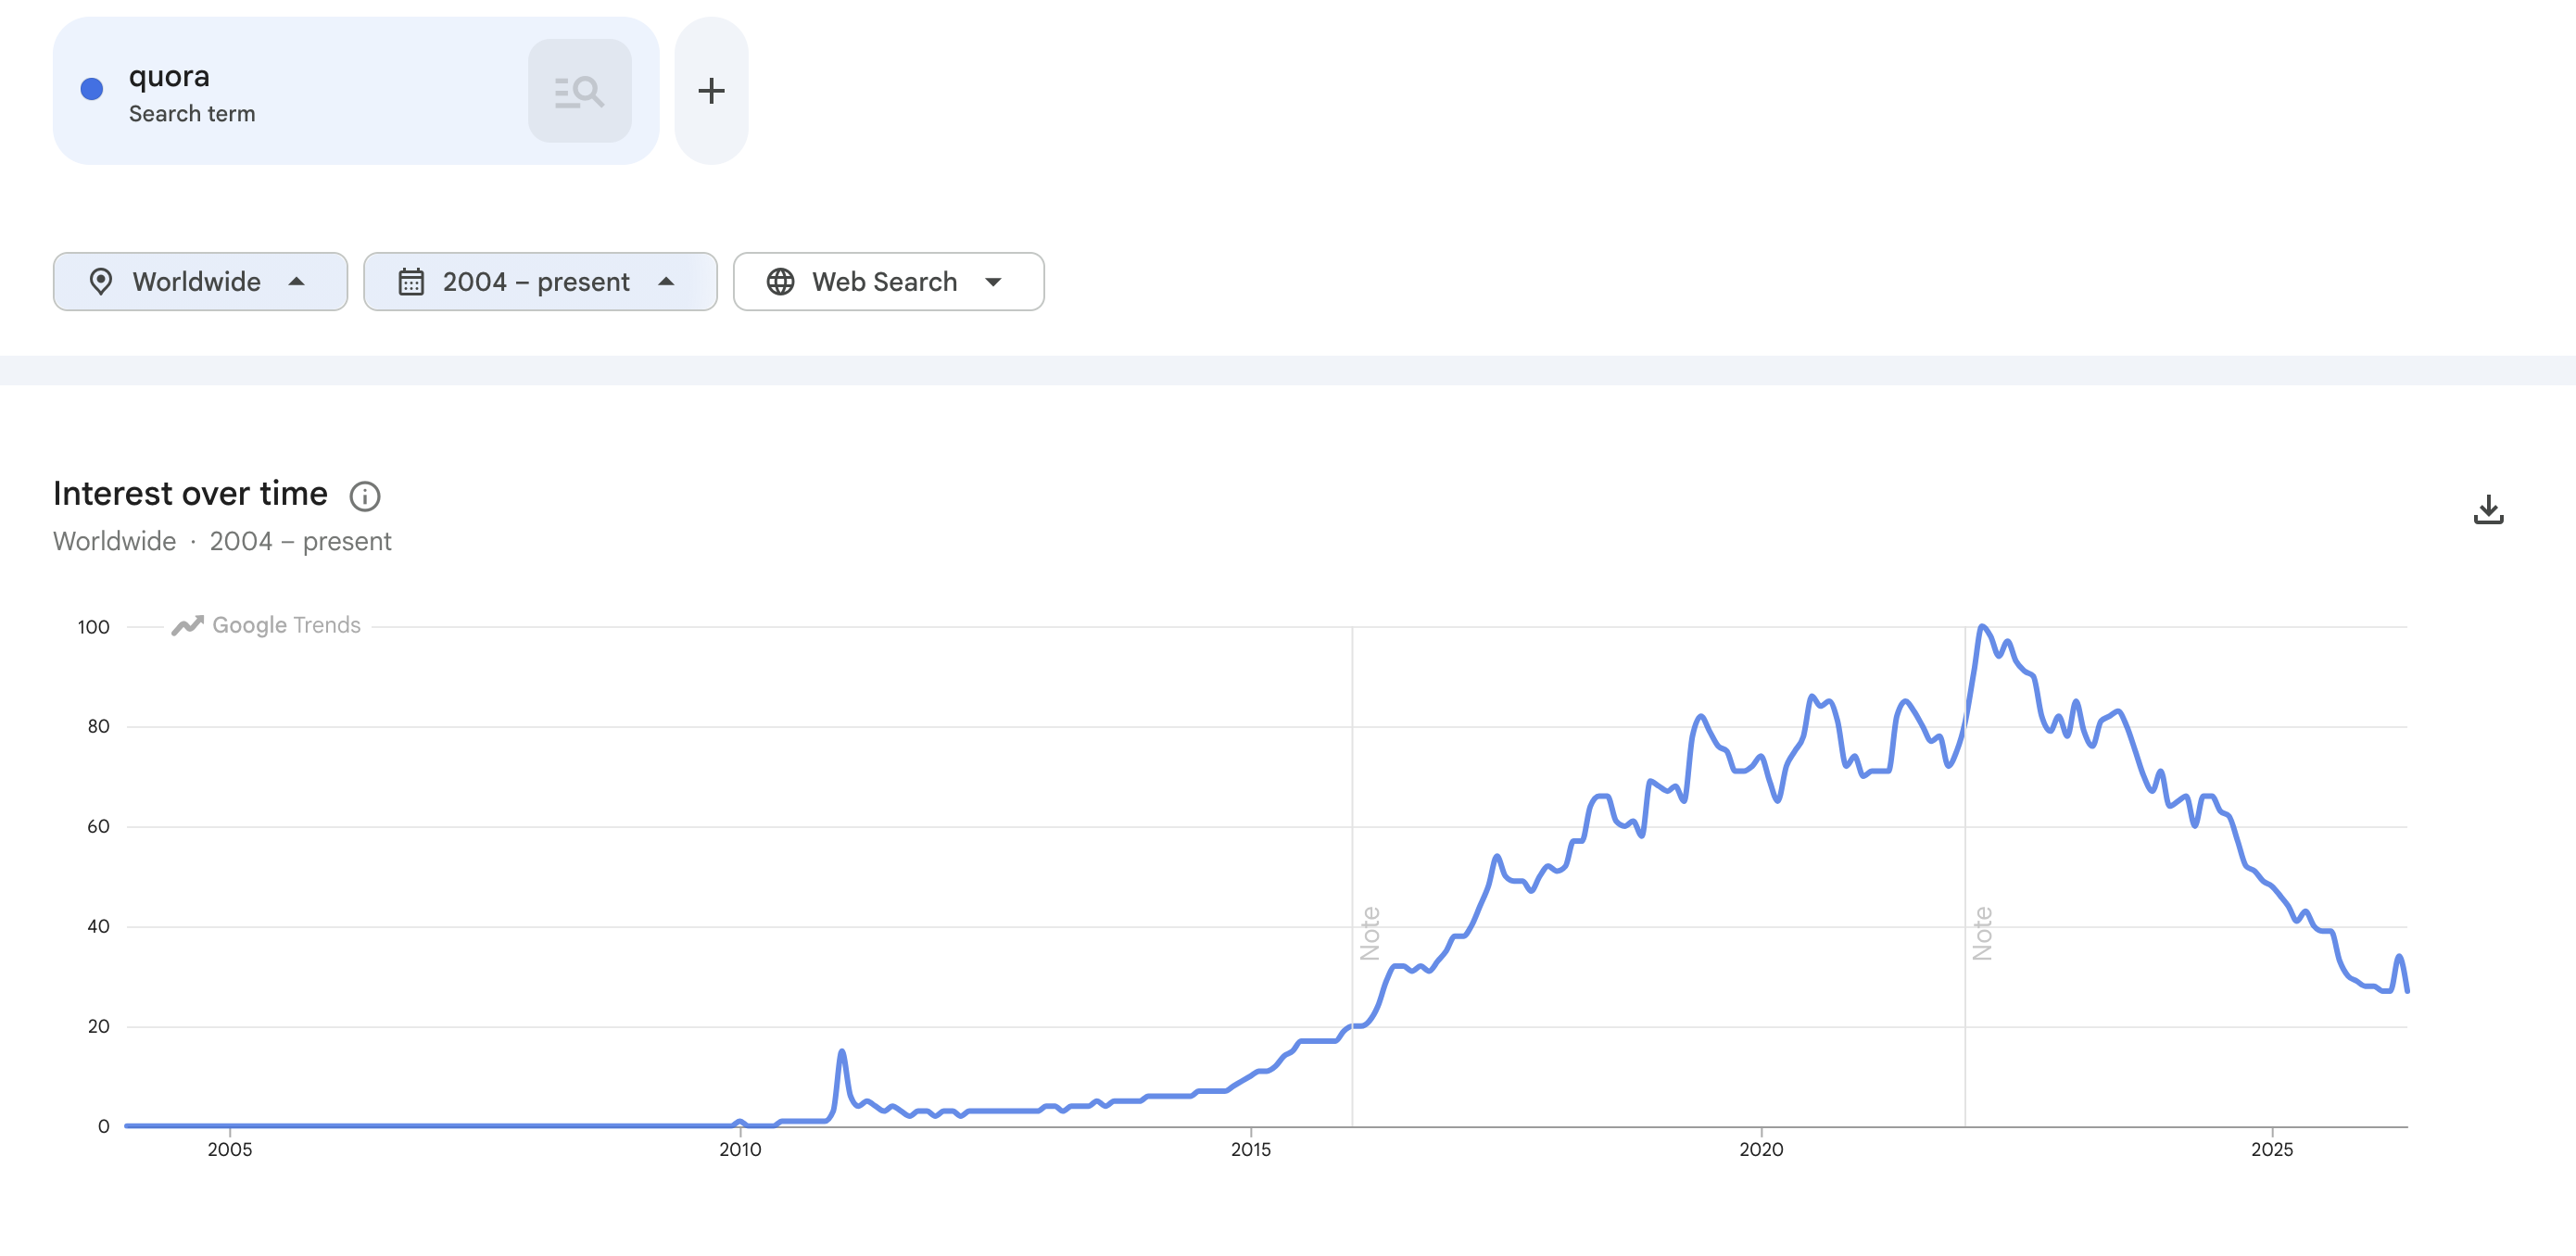
The closest analogue to Stack Overflow on this list. Peaked late 2021 / early 2022, then dropped sharply through 2023 and 2024 as the answer quality fell off and the Poe pivot pulled focus. Not dead, but visibly in the declining phase of the same curve.
The argument is probably still right
Again, I'm not saying the conclusion isn't wrong. I certainly use AI now for many of the things I used to look at Stack Overflow for. The conclusion that LLMs killed Stack Overflow is probably correct, but that doesn't make the argument that people use sound.