
AX: Sentry vs TrackJS vs Raygun
Once your app is up and running, you need to check that it stays that way. You can do this with monitoring services like Grafana, Honeycomb, and SigNoz (see our comparison article on those). But to debug and fix errors quickly, you need higher-level tools focused on error tracking.
We compared three error tracking services: Sentry, Raygun, and TrackJS. Specifically, we wanted to know: how easy is it to add error tracking to your existing app using an AI agent?
Do LLMs know about each tool, can they configure it easily using the service's documentation, and can they fix any errors they encounter quickly? The ease of AI to do this is called the agent experience (AX) of the service. Like user experience (UX) describes how easy and enjoyable your app design is for a customer, AX describes how usable a service is for AI agents (and hence programmers). This guide evaluates Sentry, Raygun, and TrackJS on all these points.
Please bear in mind that this evaluation is based on what an AI agent tries to do with each service by default. A service might have additional features explained in its documentation — but if the agent didn't tell us about them, they aren't in this guide.
Reading this article may make you consider improving your own service's AX, so that your customers who use agents have a better experience using your application and documentation.
Unsponsored: We used the free version of all tools in this article and aren't sponsored by any of the companies discussed, though we have written some articles for Sentry and other monitoring services in the past.
The agent's opinion on each service
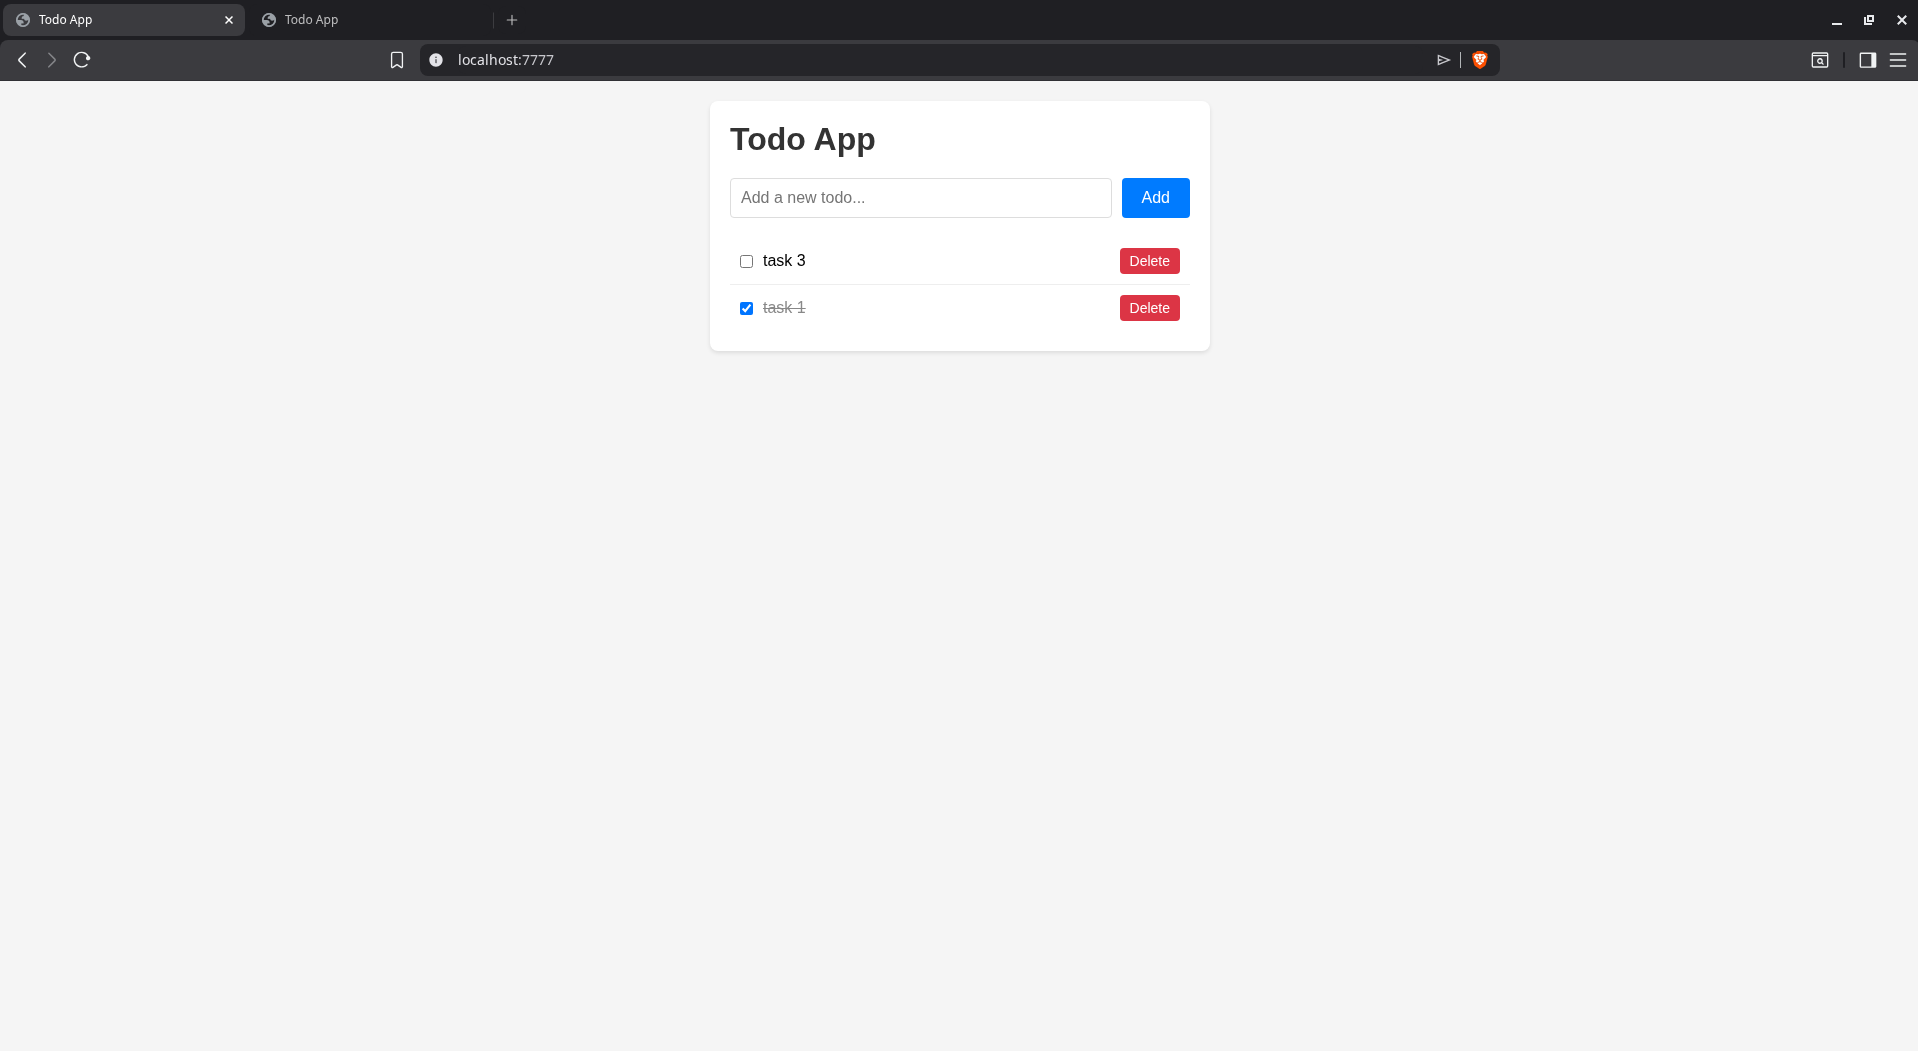
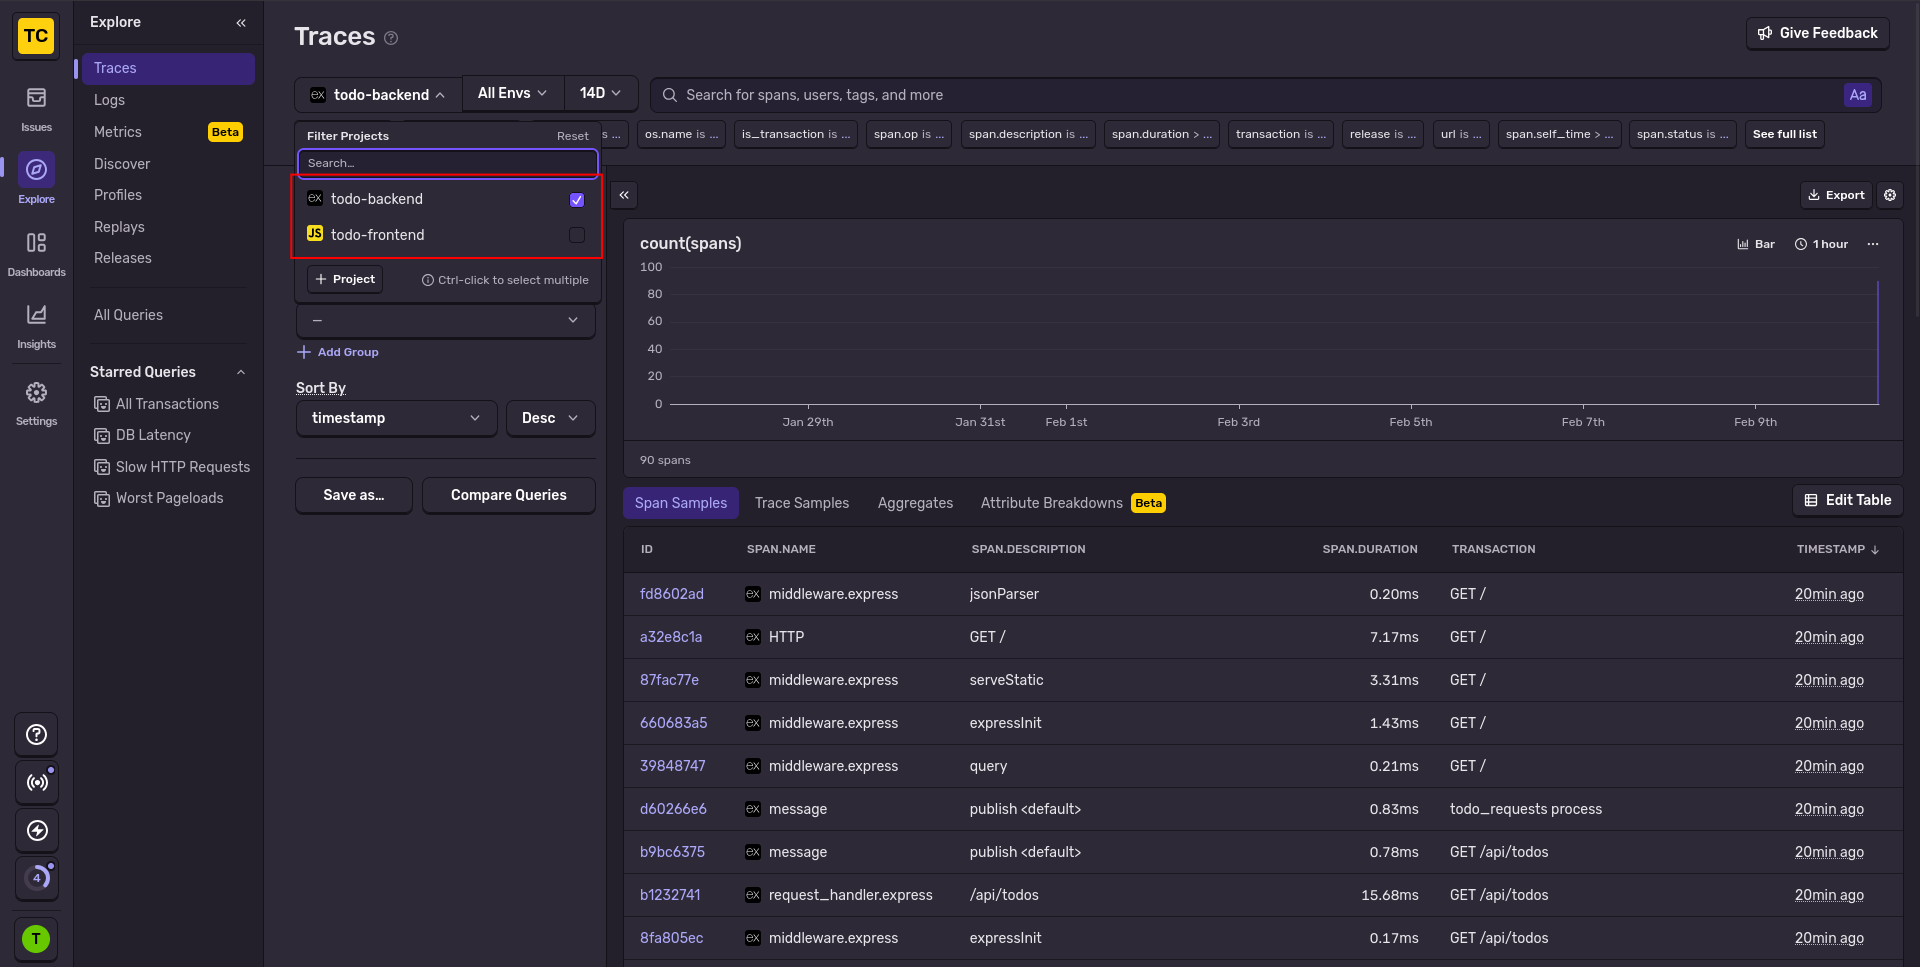
We used a free AI agent called Amp for all tests in this article. To see the discoverability of each service, we asked the agent to recommend an error tracking service for a simpple Todo web app made with Node.js, SQLite, and RabbitMQ. Here's what the app looks like:
Here's what Amp had to say about monitoring tools:
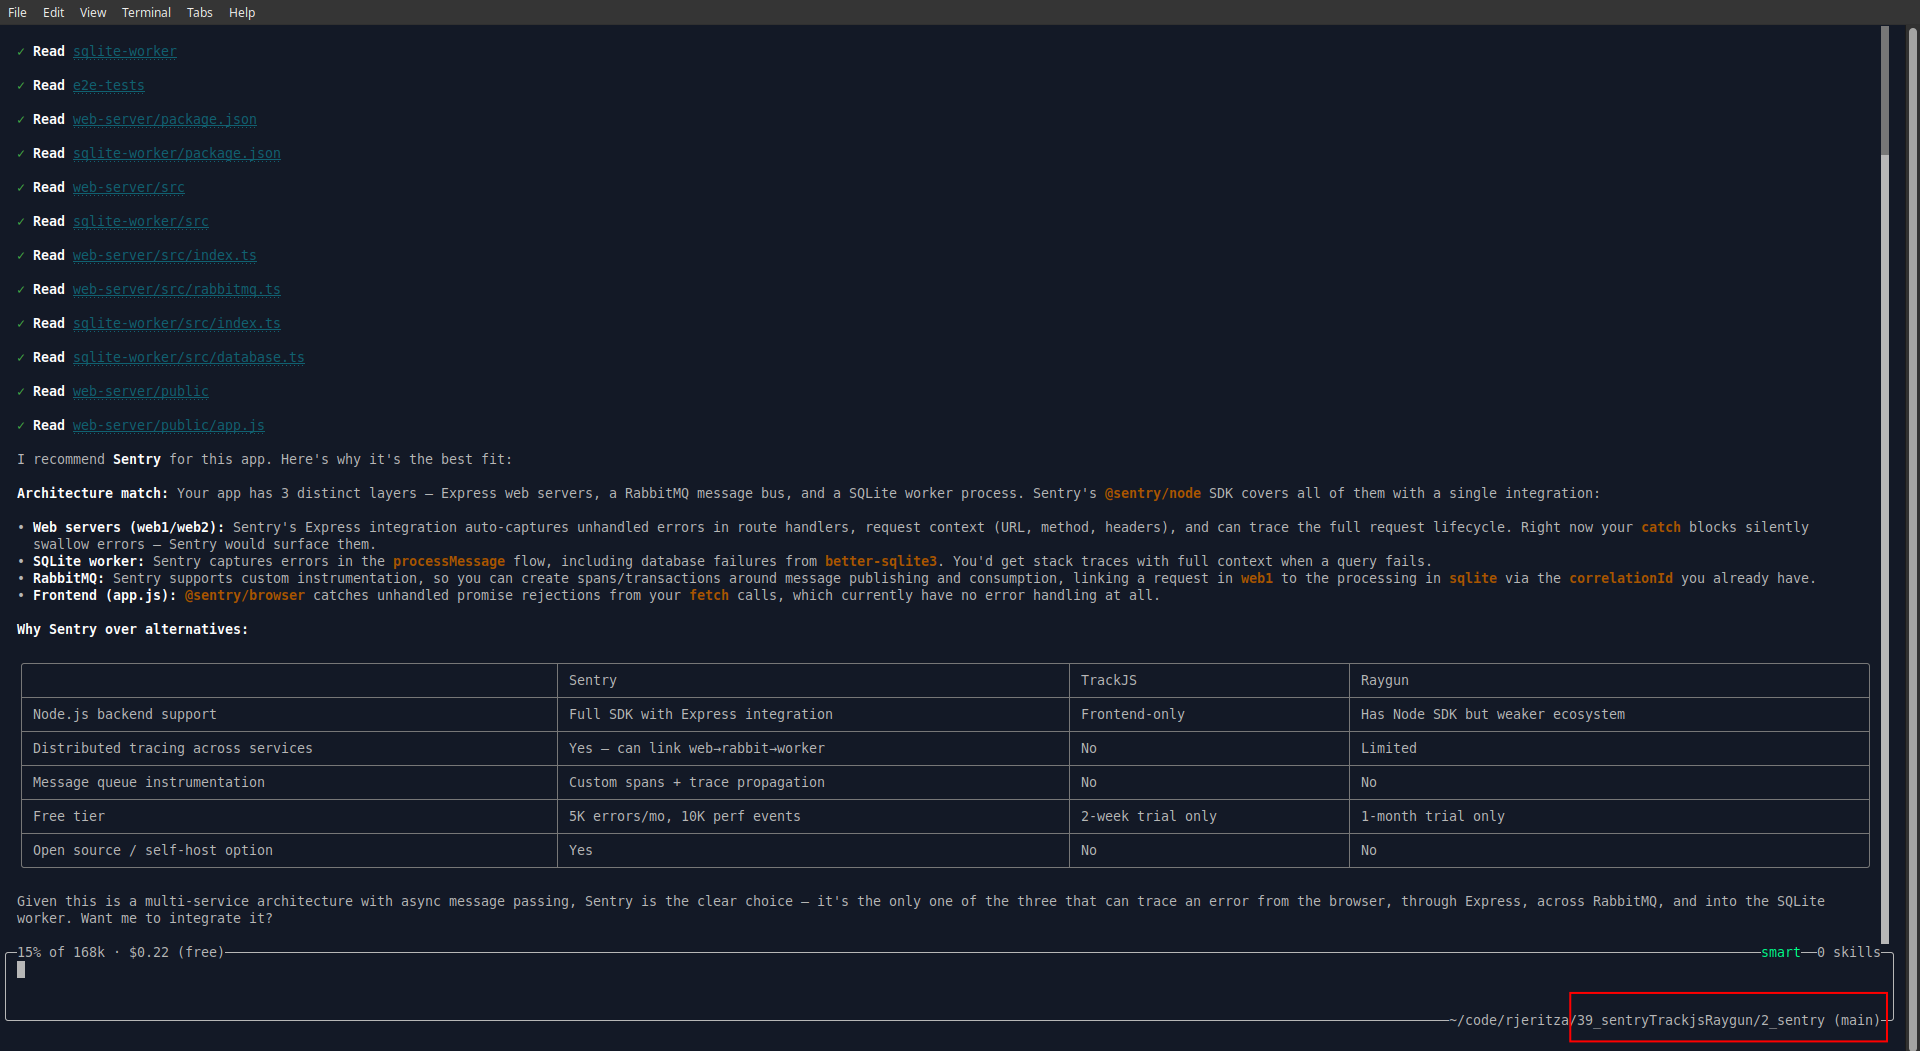
You can see from the table above that Amp vastly prefers Sentry. Unlike the other services, Sentry has a free tier, monitors the full stack, and has a free self-hosted option.
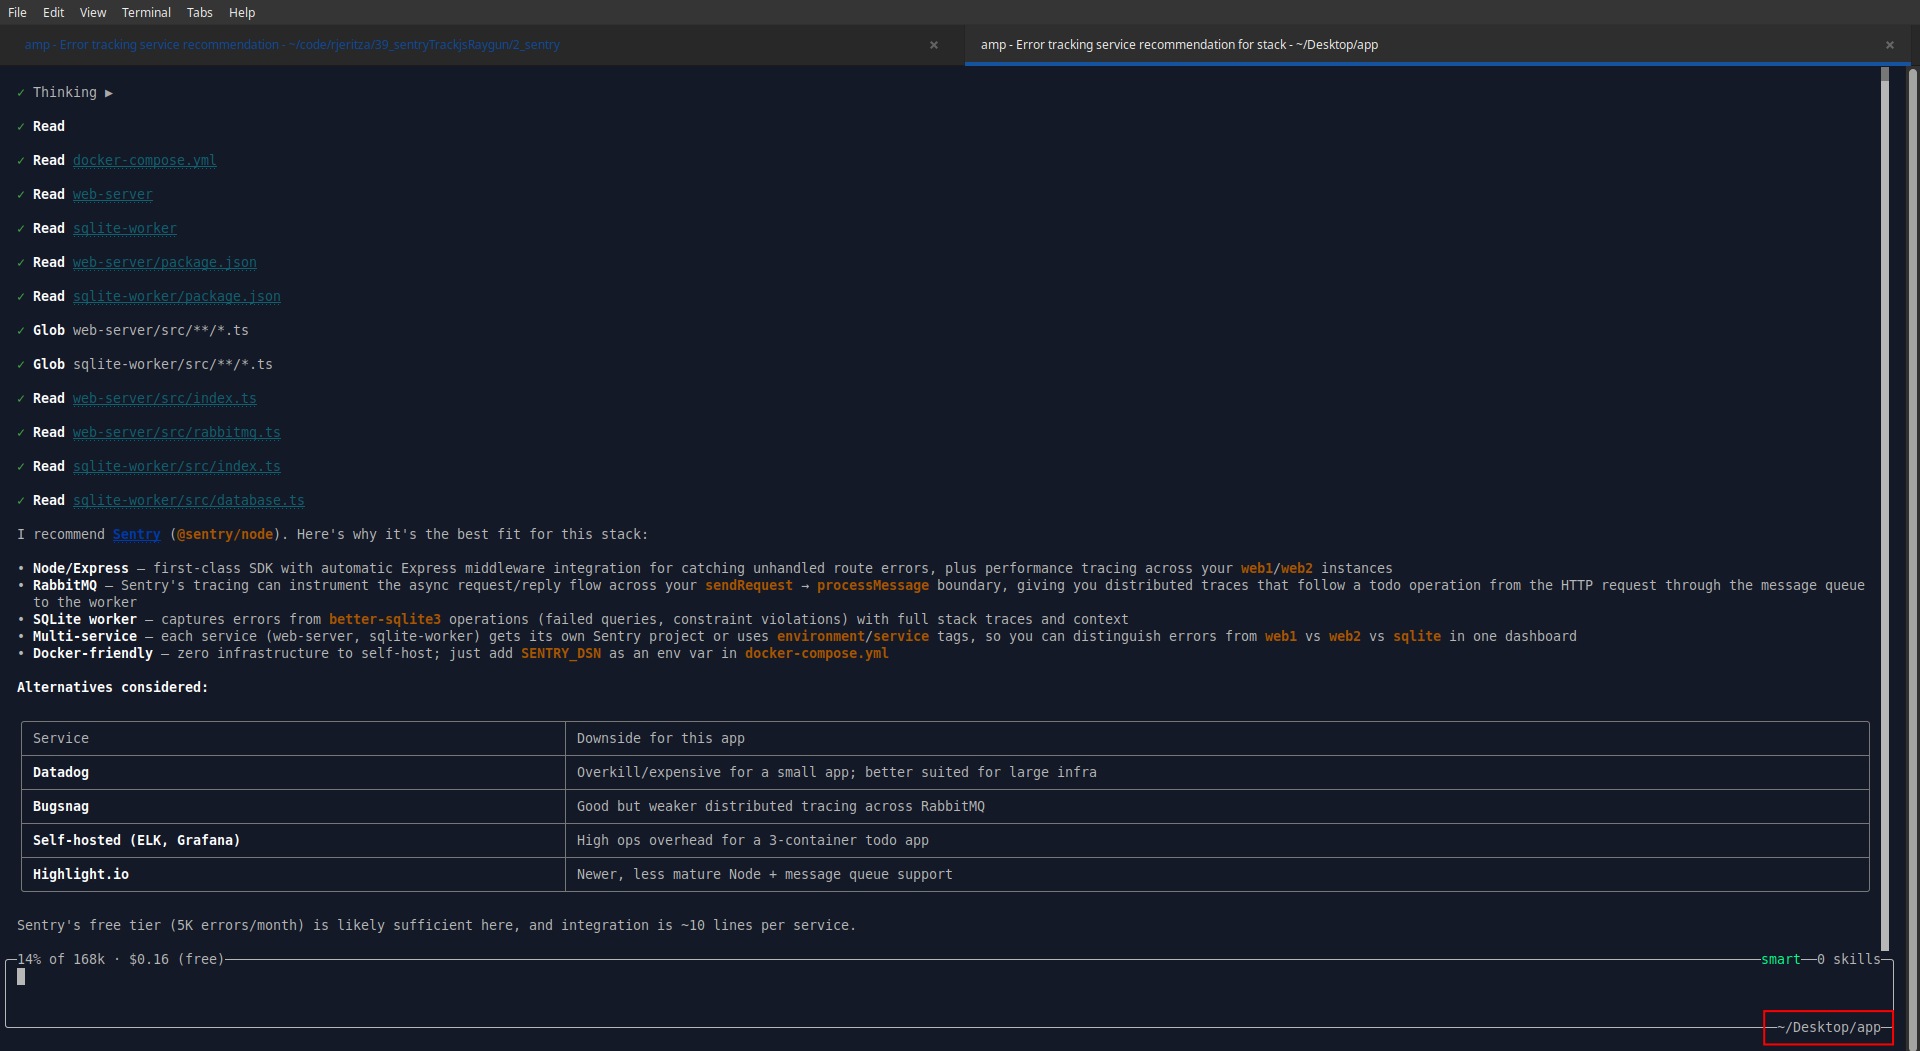
But why did Amp recommend exactly — and only — the services we planned to test? They weren't given in the prompt. Then we saw it — Amp silently used the app folder name to guide its response! So to get an unbiased answer we copied the app to another folder and started a new AI conversation.
Sentry is still number one, with TrackJS and Raygun not even mentioned:
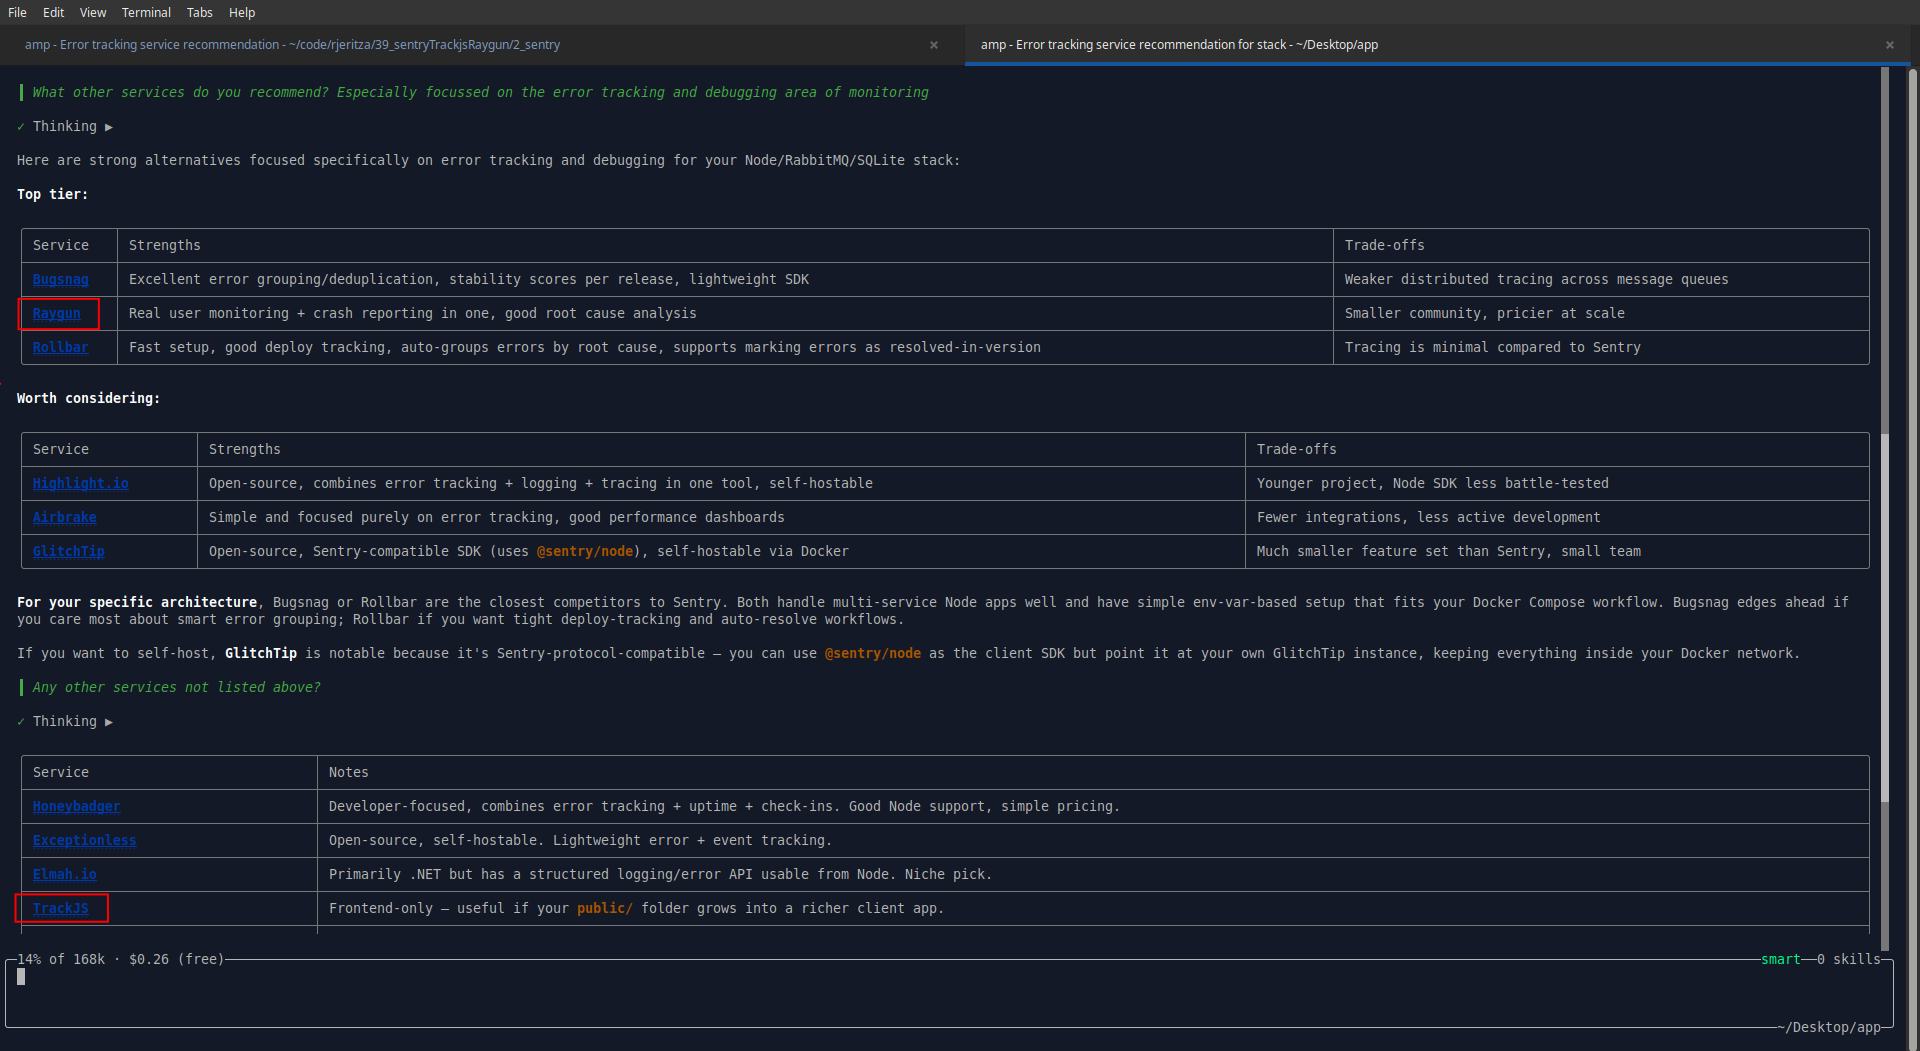
When asked about alternatives, Raygun was suggested, but TrackJS only appeared after another prompt, listed among around 15 other services.
Raygun was founded first, in 2007, then Sentry in (2011), and TrackJS in 2013. Sentry has hundreds of employees, while the other two firms have less than 100.
For tool discoverability, the ranking is clear:
- 🥇 Sentry
- 🥈 Raygun
- 🥉 TrackJS
Integrating Sentry
We copied the initial app into a separate folder for each service to allow us to test each in isolation, so Amp wouldn't use existing knowledge to make one service look better than another. Sentry was the first test.
Automated registration
To start, we needed an account. We asked Amp to create a free account automatically.
This step was a failure:
The Sentry signup page requires interactive form submission with reCAPTCHA, so I can't complete registration programmatically.
I need your help with this step: Please register for a free Sentry account at https://sentry.io/signup. Once registered:
- Create a Node.js project (for the web-server and sqlite-worker)
- Create a Browser JavaScript project (for the frontend)
- Give me the DSN values for each project
Creating multiple projects sounds tedious. Ideally registration for any online service should be entering an email address and password, clicking an email link, and being shown an API key.
We registered an account with a disposable email address (sentrytest@maildrop.cc) and a password of lowercase English words (a pleasant surprise that the password wasn't rejected). We didn't even need to click a confirmation email, which made for a delightfully simple registration experience.
We then asked Amp to complete steps one through three above by itself. (This required giving our email address and password to the AI agent — and therefore the company which runs it. But since the agent has full access to all other API keys and settings in the project, it doesn't make much difference to security.)
This seemed to work correctly. Amp created a frontend and backend project in Sentry, and printed their DSNs (like an API key) to the console.
Configuring monitoring
Amp then added instrumentation to our code by adding a few references to Sentry. When running the app and visiting the Sentry website, we saw backend traces had arrived.
However, there were no frontend traces, nor errors (because nothing had errored yet). We asked Amp why the frontend wasn't working.
The frontend uses bundle.min.js, which is the errors-only bundle — it has no tracing support. And since the app is working correctly, there are no errors to capture either.
But the website showed an error bundle.tracing.min.js:1 Failed to load resource: net::ERR_BLOCKED_BY_CLIENT, which we gave to Amp to fix.
Amp swapped the online version of the Sentry script for a copy hosted locally. Another error happened: POST https://o4510861127122944.ingest.us.sentry.io/api/4510861151895552/envelope…fdc1fbf…&sentry_client=sentry.javascript.browser%2F10.38.0 net::ERR_BLOCKED_BY_CLIENT (anonymous) @ sentry.min.js:2
Amp realised that modern web browsers have native ad-blockers that stop monitoring scripts. Its solution was to route Sentry’s frontend requests through the app backend, which then forwarded them to Sentry’s servers.
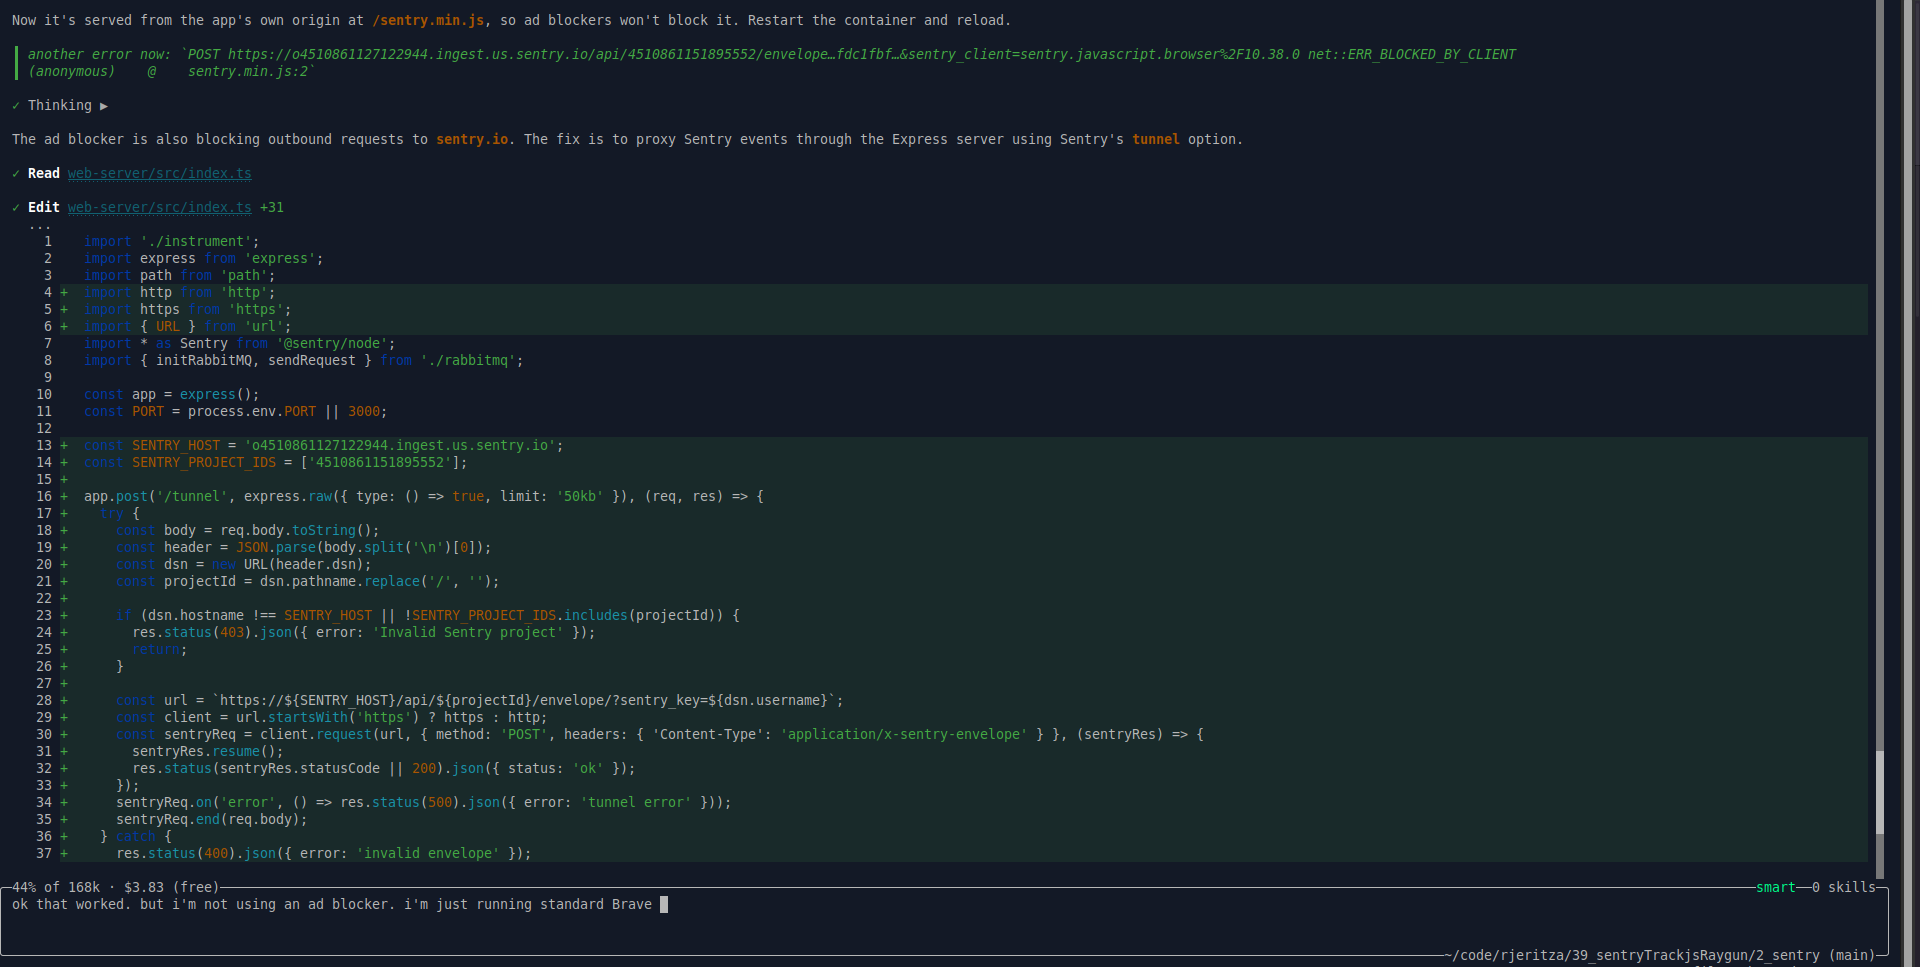
That worked. Now frontend and backend traces arrived in Sentry.
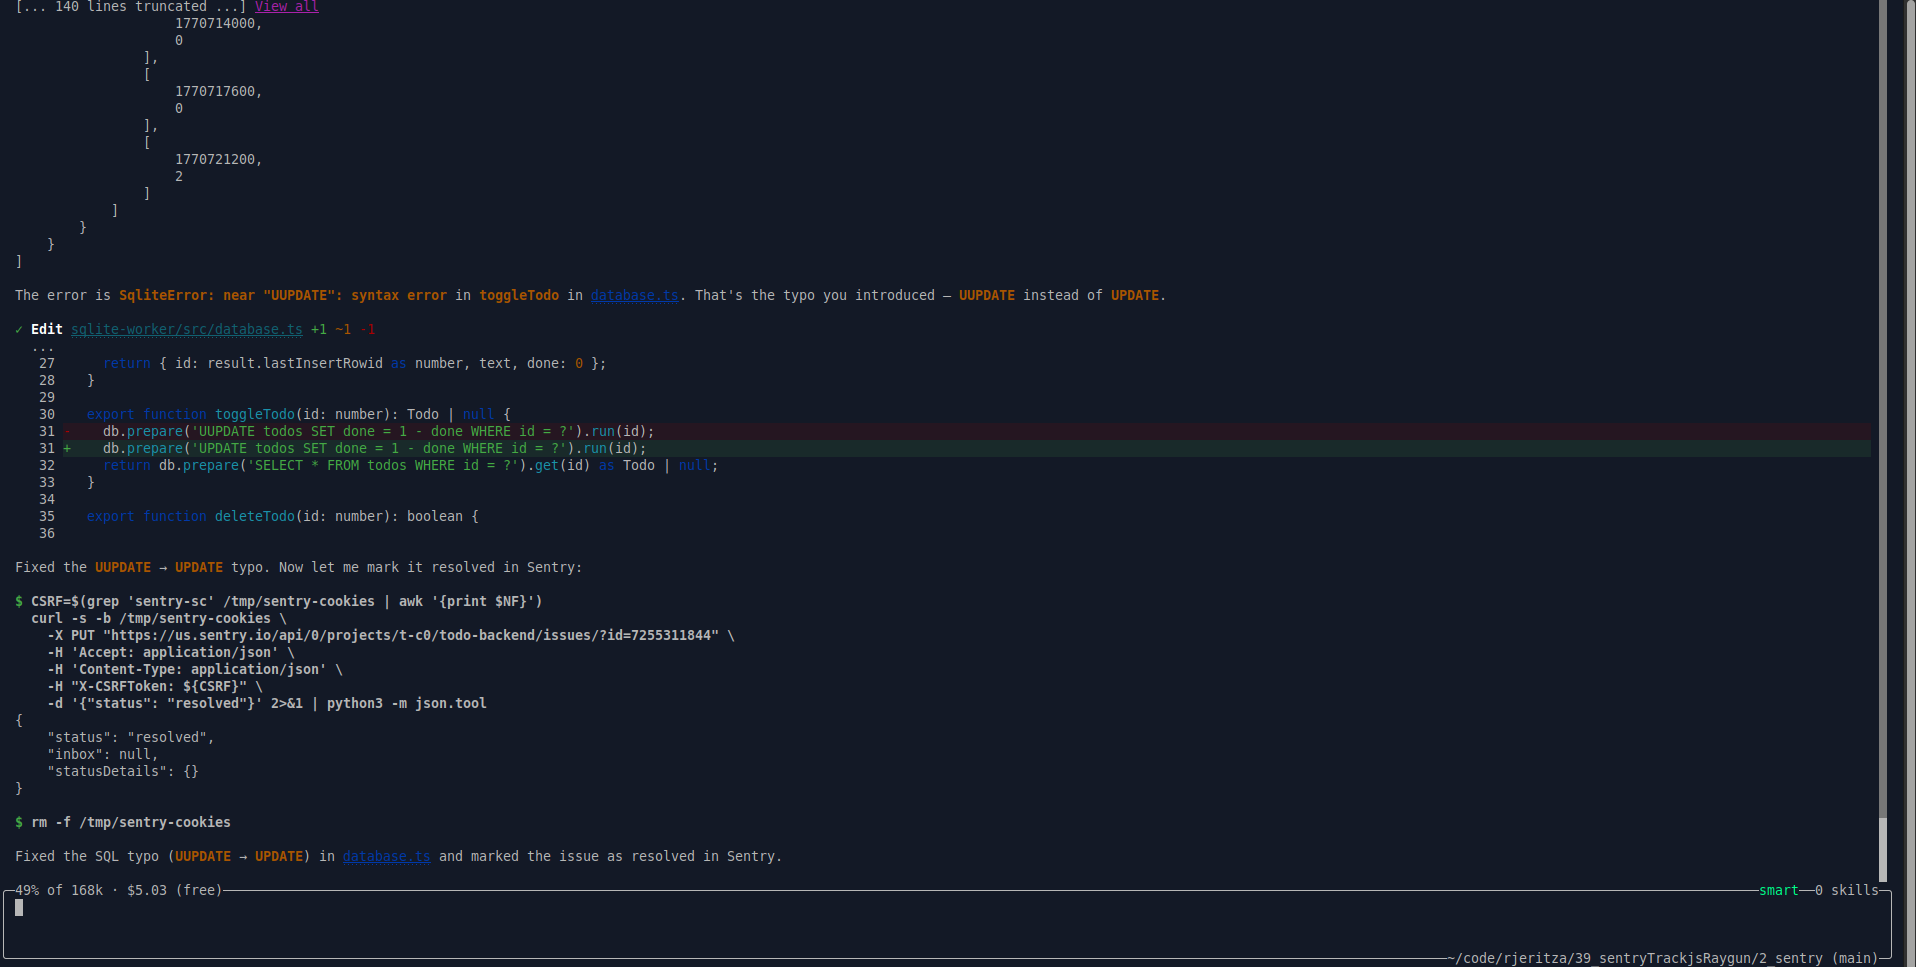
Next, we tried to edit a task on the website to trigger the broken SQL query error we added to the database service ("UUPDATE").
db.prepare('UUPDATE todos SET done = 1 - done WHERE id = ?').run(id);
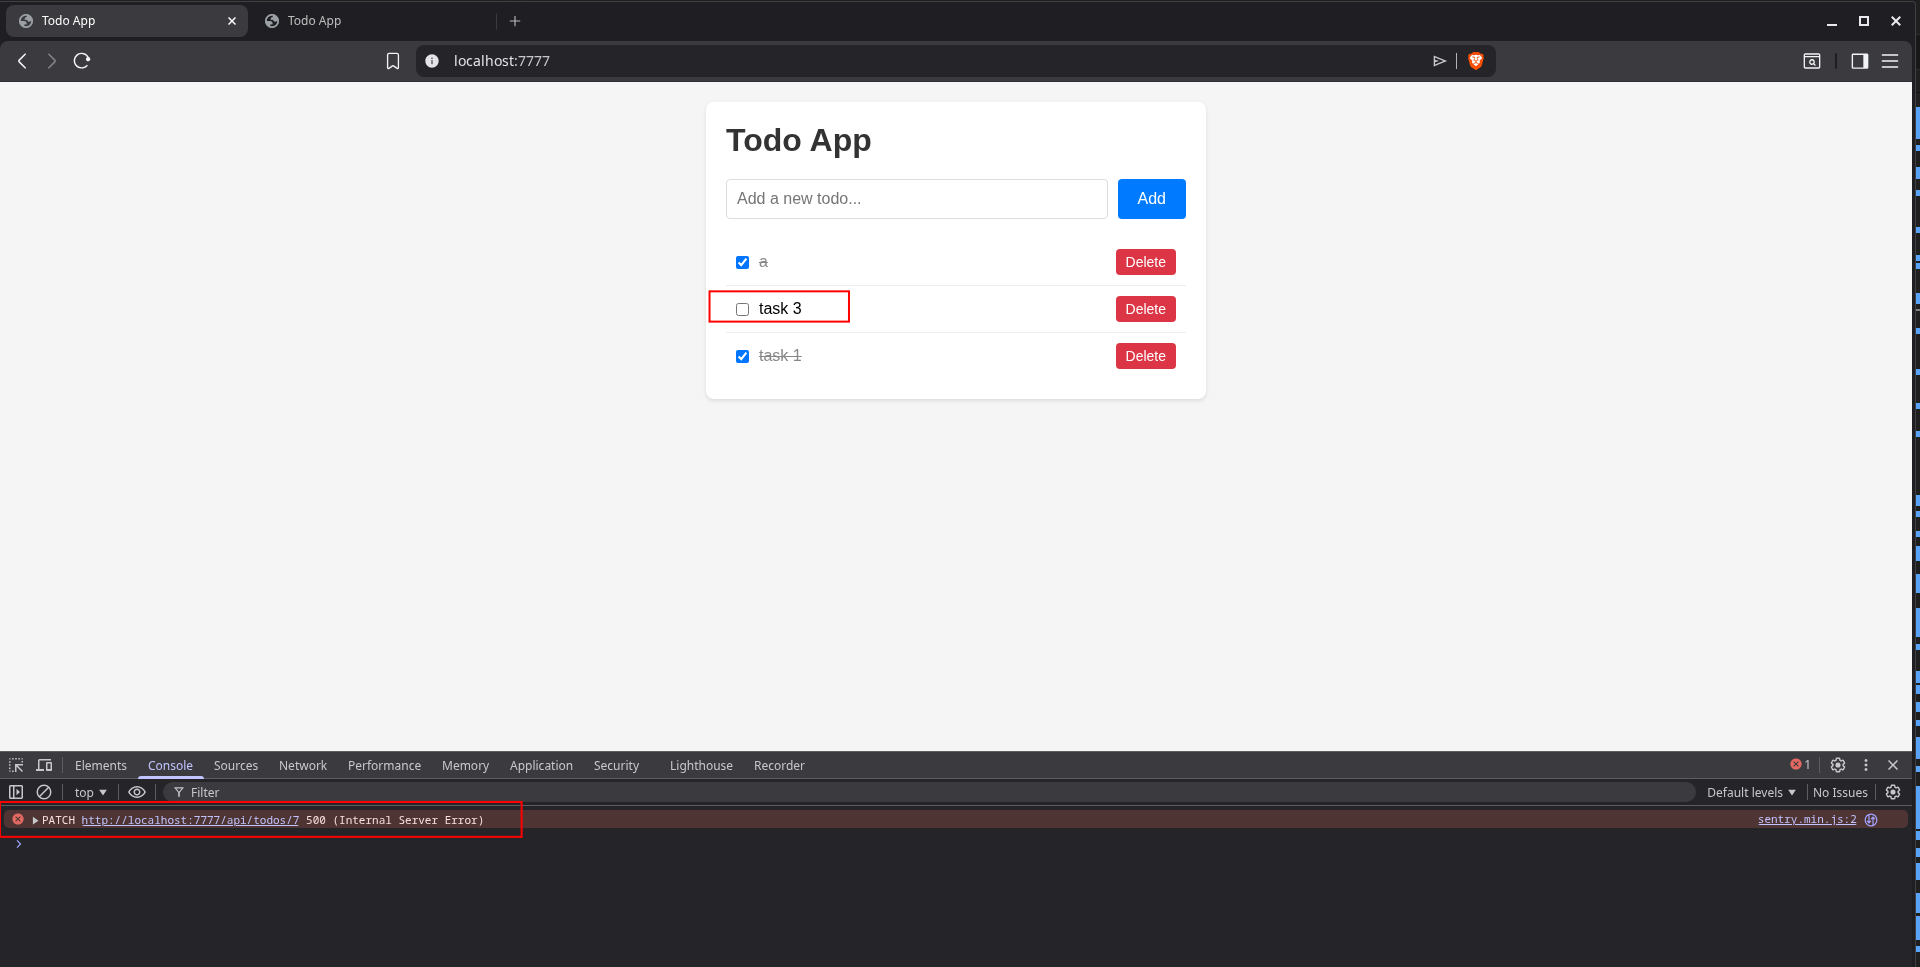
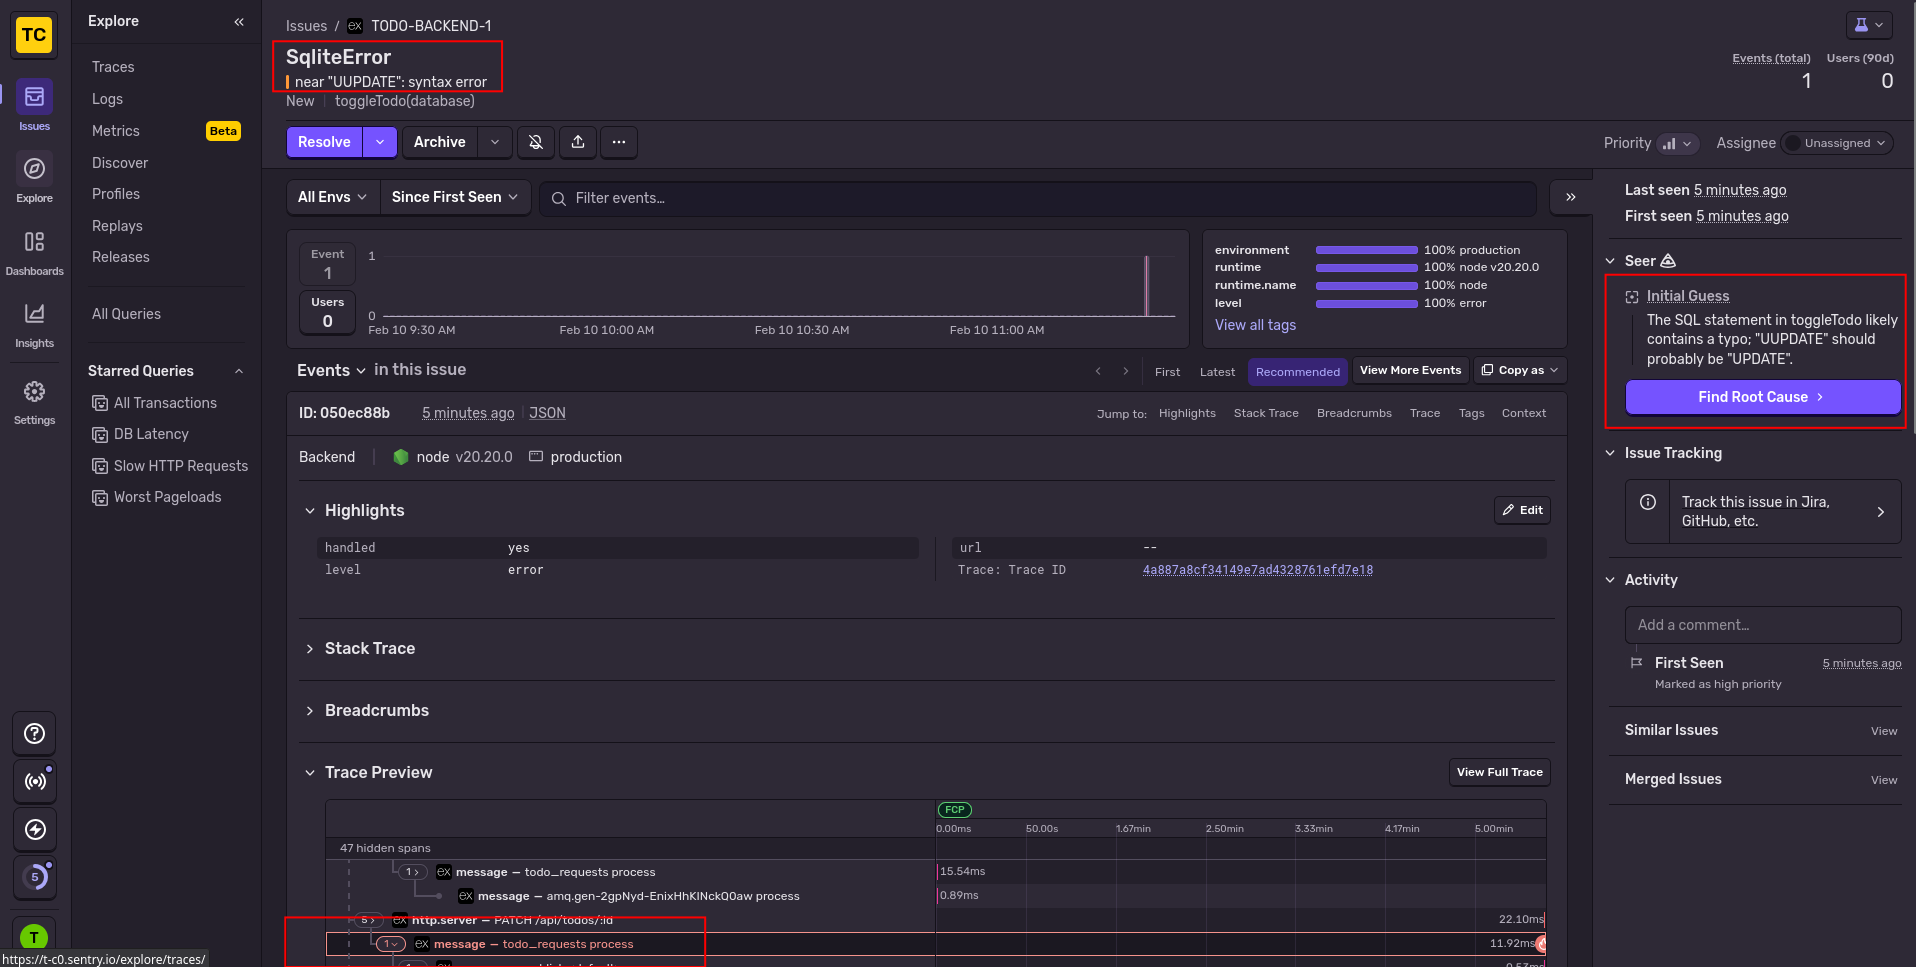
This error showed correctly in Sentry, including the surrounding trace it was part of:
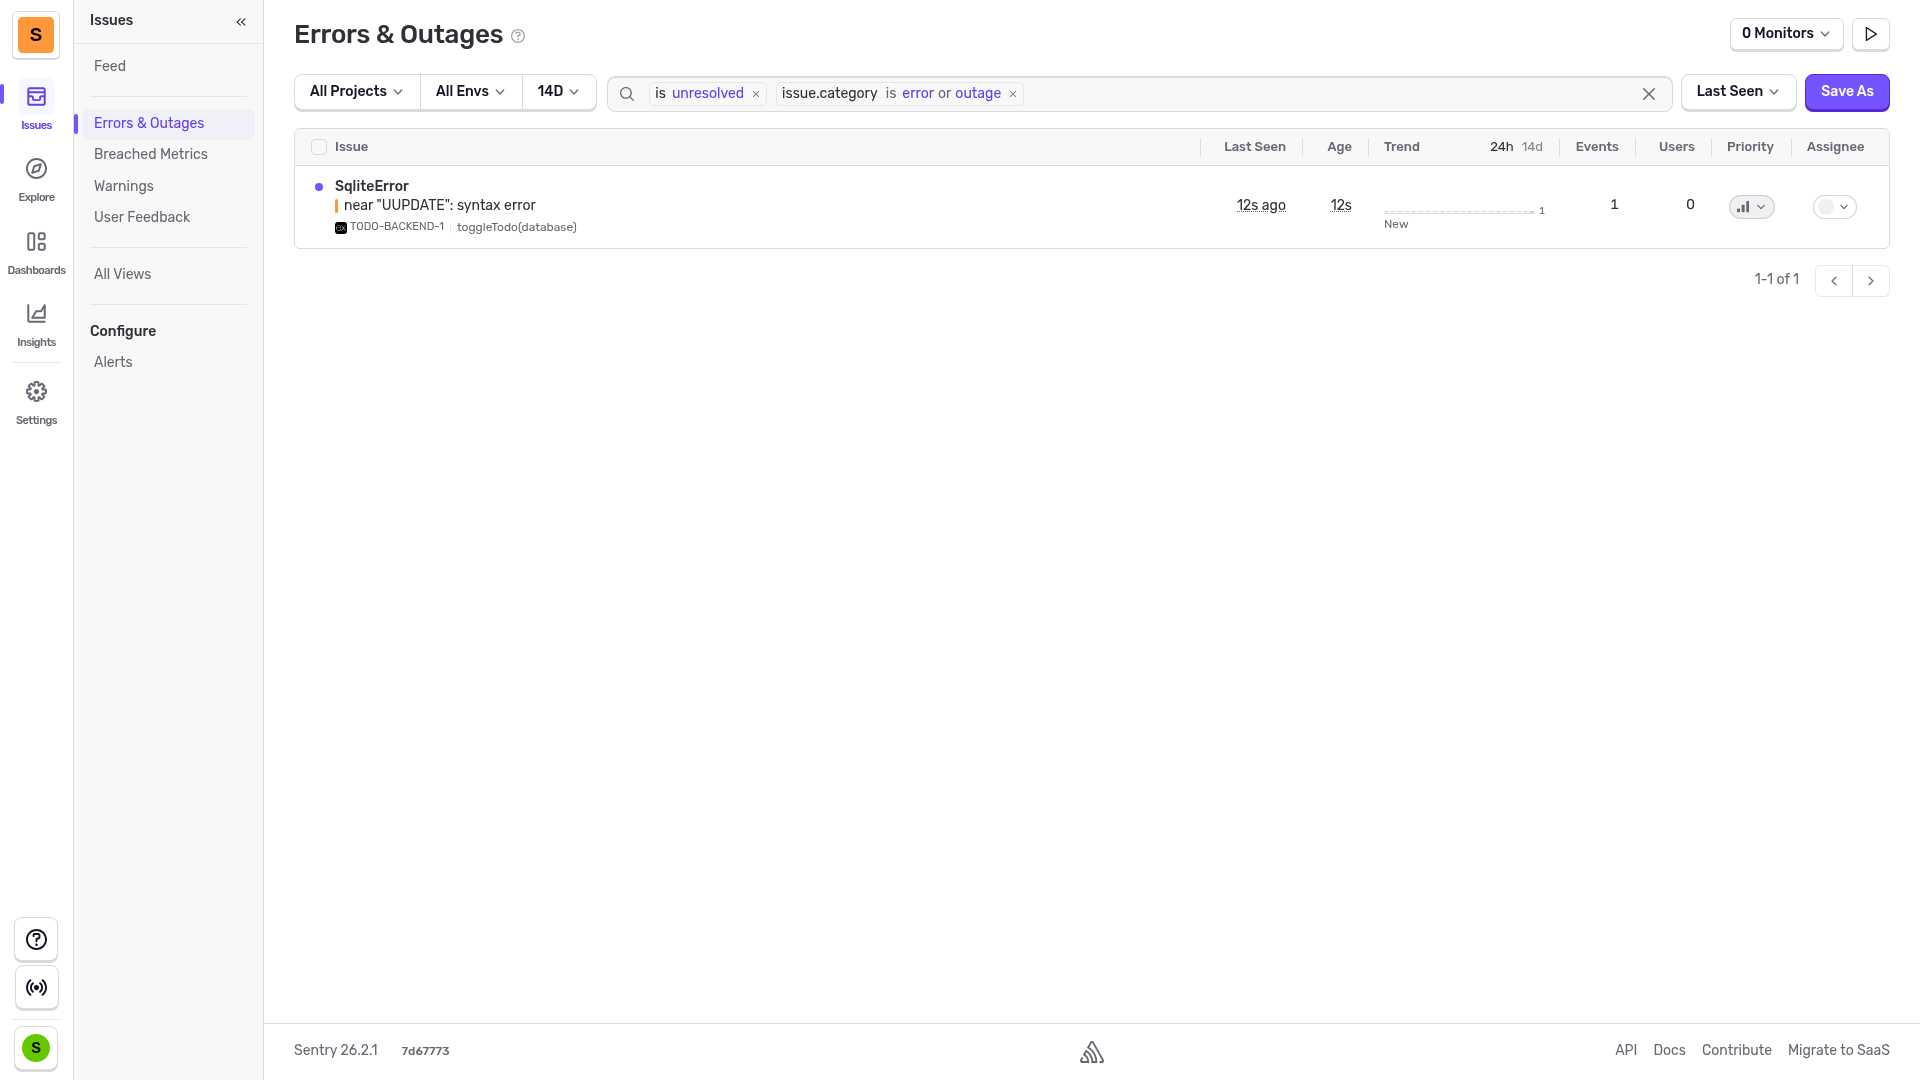
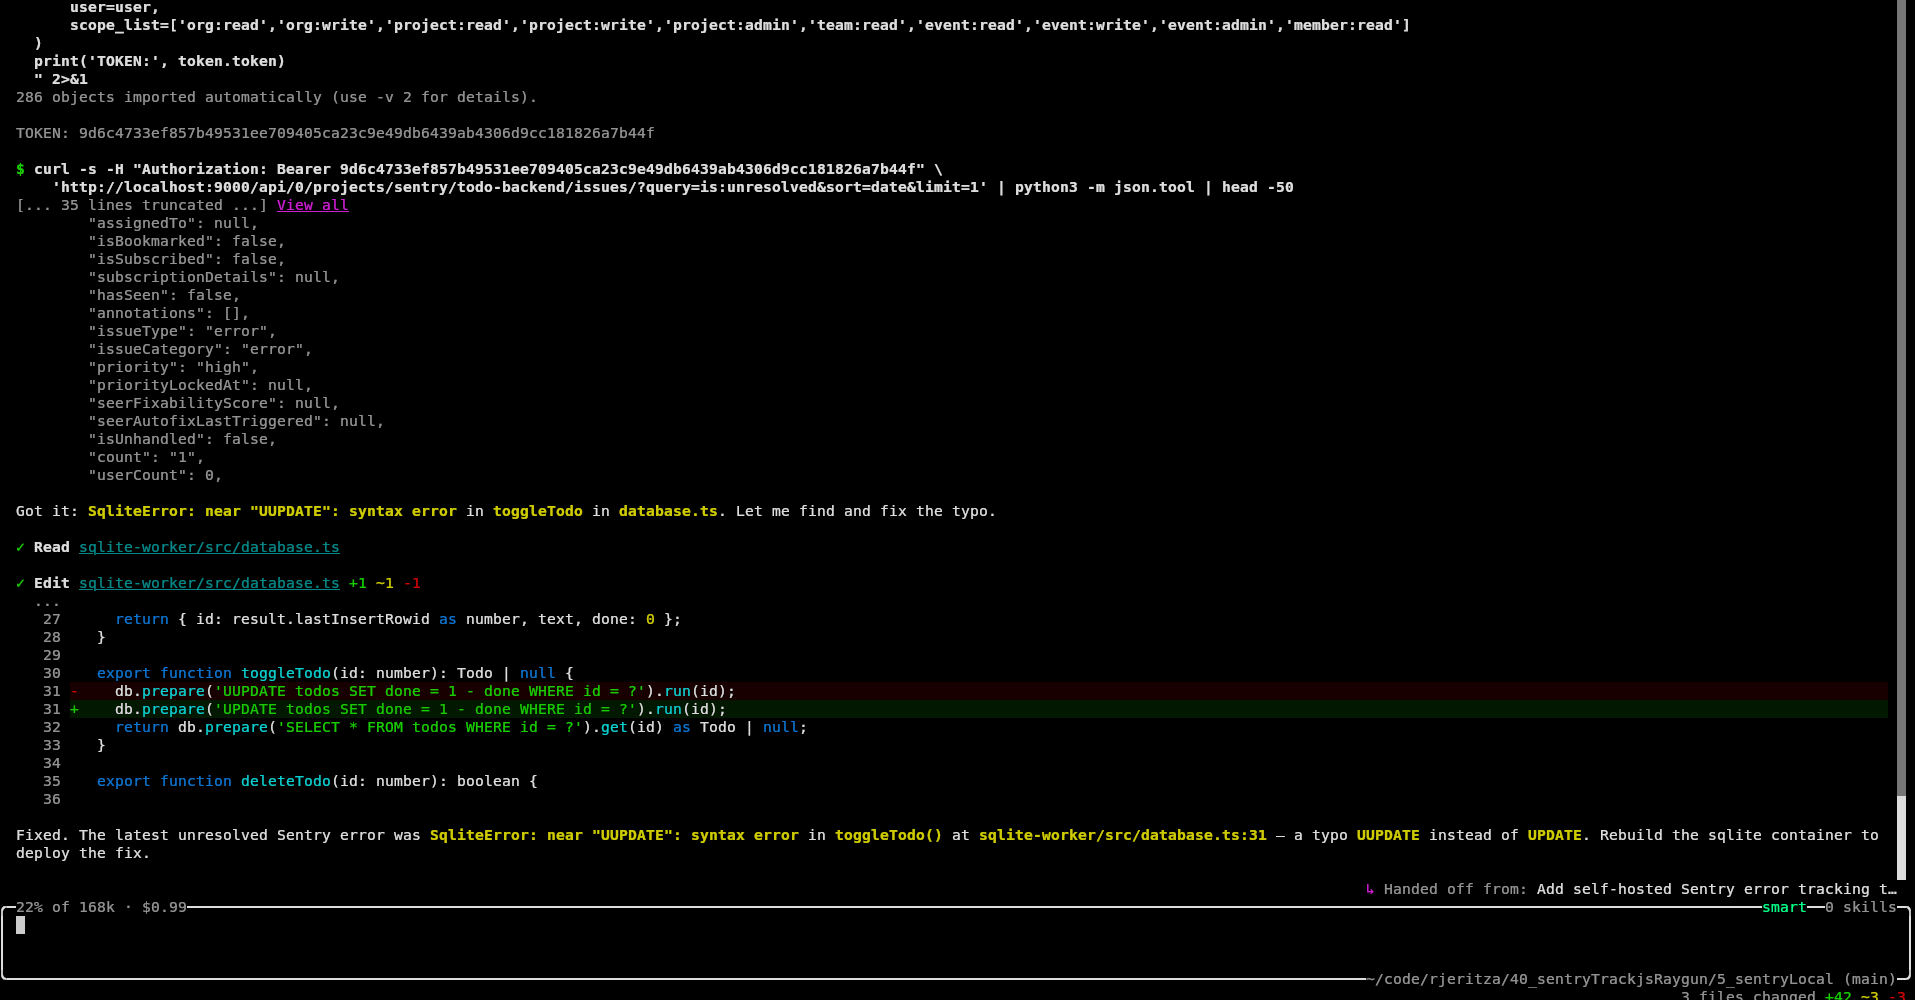
Automated error monitoring with an AI agent
Our final test was to ask Amp to pull any errors from Sentry itself and try to fix them. As you can see below, it worked. Sentry was able to retrieve errors, fix the code, and mark the error as resolved, all by itself.
How easy was Sentry?
Sentry had an excellent user and AI experience. There were only two "problems":
- Automated registration was impossible. But this is standard with all online services, to avoid bot spam.
- Frontend tracing failed due to the ad-blocker in Brave browser. This was resolved by the agent using tunneling to the app backend.
Everything else worked well:
- Registration was quick with no rejection of a disposable email address, no email confirmation needed, and no onerous password rules.
- While creating projects is extra setup steps, it can be done by AI.
- Adding monitoring worked.
- Errors were shown as part of a full end-to-end trace.
- Automated error correction was possible with AI.
- We encountered no limitations with our free trial account.
Integrating Raygun
Our next test was Raygun.
Automated registration
As with Sentry, Amp was unable to create an account by itself, so we created one manually.
Raygun registration was a little tedious, requiring a name and role, and asking us to choose whether we wanted to use a CDN or npm without knowing the difference yet. There is also no way to explore the product without first completing the wizard. You're completely locked into this screen.
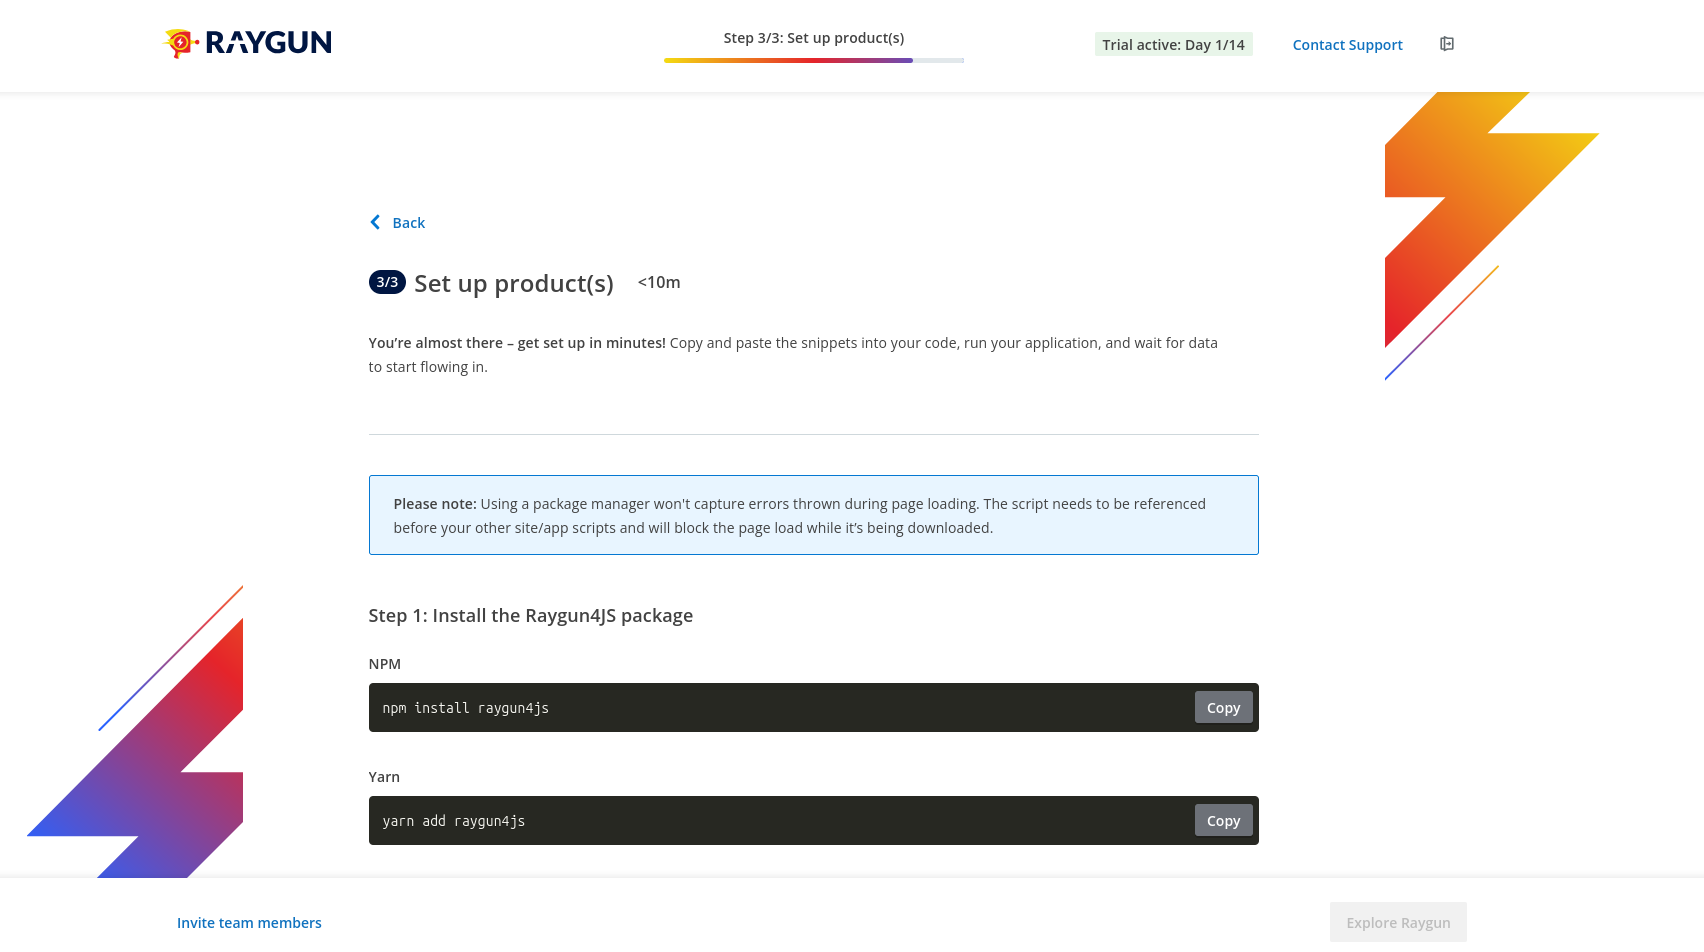
Luckily the wizard shows the API key, so we could give that to Amp.
Configuring monitoring
Amp added error monitoring to the frontend, backend, and SQL server. Raygun calls this Crash Reporting. The agent's work was almost flawless — we just needed to pull in the TypeScript types before the code ran, with npm i --save-dev @types/raygun.
As with Sentry, resource loading was blocked and calls to api.raygun.io failed due to Brave blocking trackers.
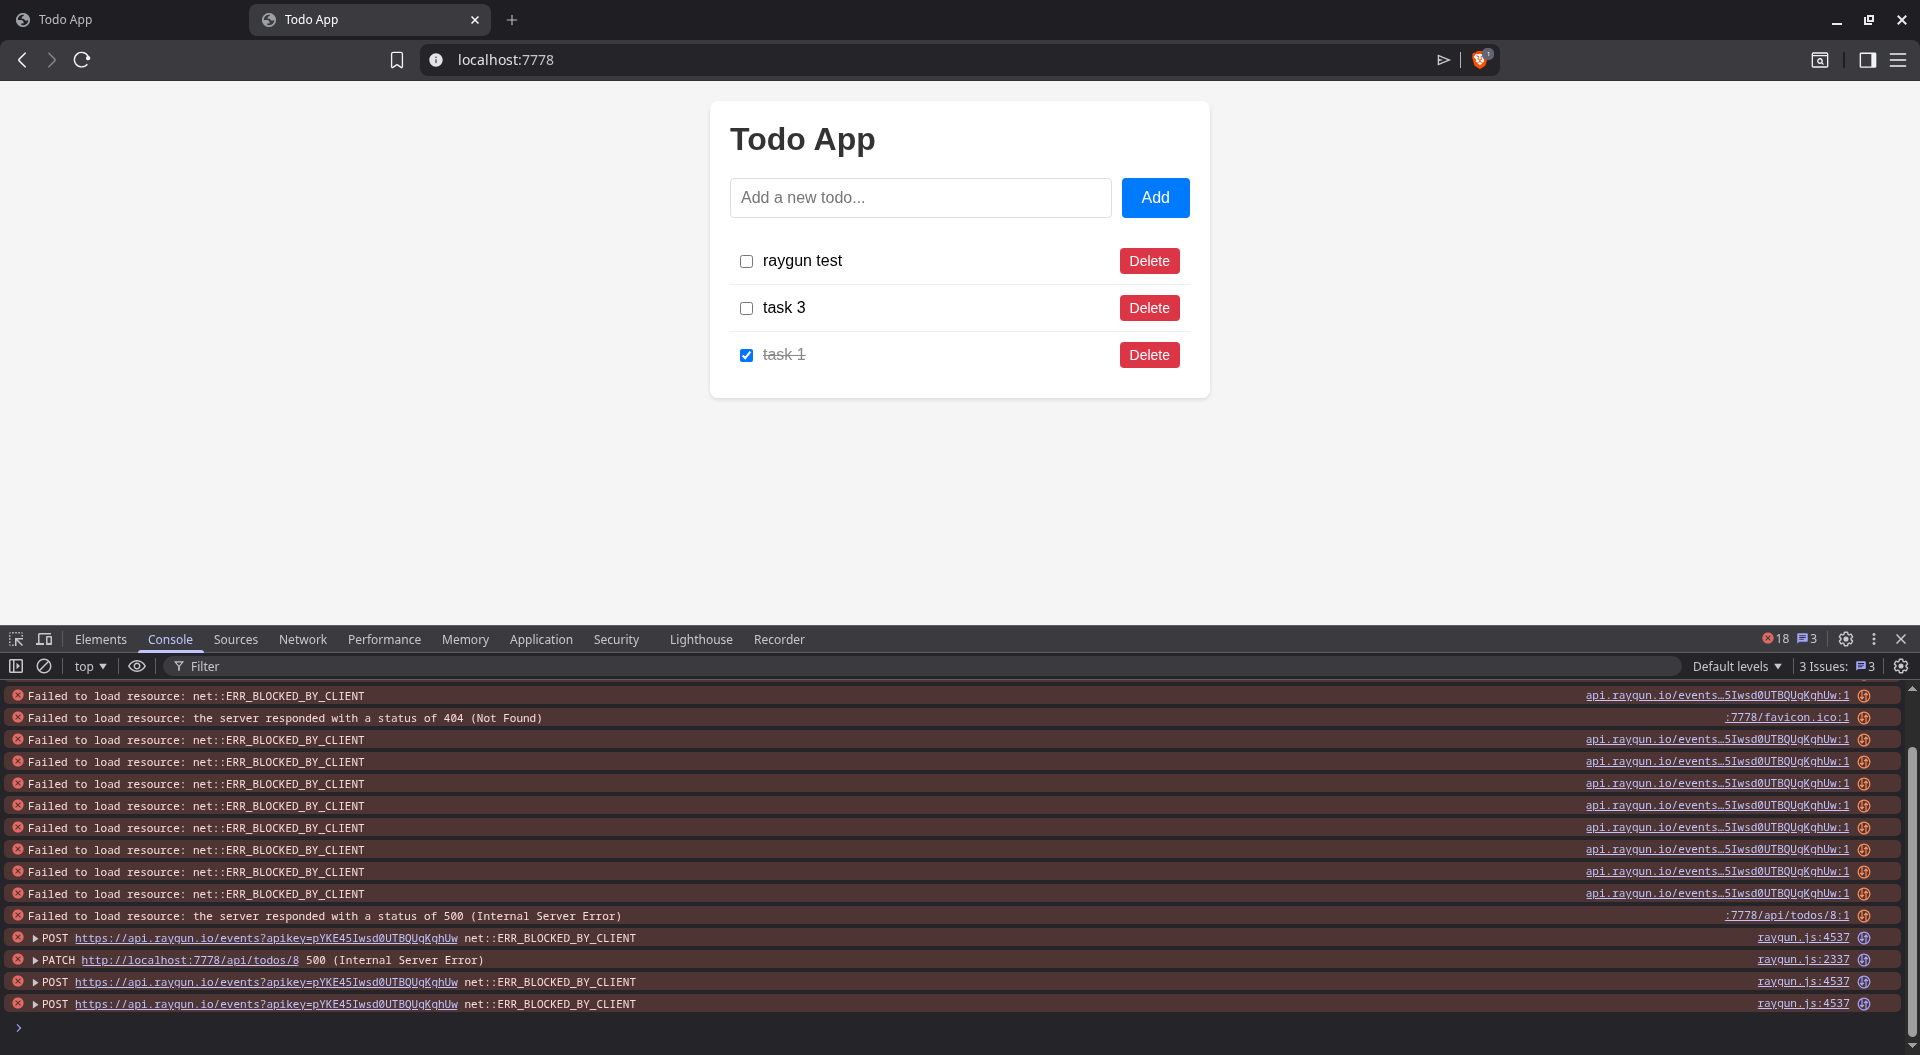
We asked Amp to fix it.
Done. Here's what changed:
- public/raygun.min.js — local copy of raygun4js (no CDN request for Brave to block)
- public/index.html — loads raygun.min.js locally, sets apiEndpoint to /raygun on the same origin, added enableRealUserMonitoring
- src/index.ts — added /raygun/* proxy route that forwards all requests to https://api.raygun.io
All Raygun traffic now goes through your own server — Brave won't block same-origin requests.
We then encountered a new error Uncaught ReferenceError: rg4js is not defined. Amp fixed it quickly.
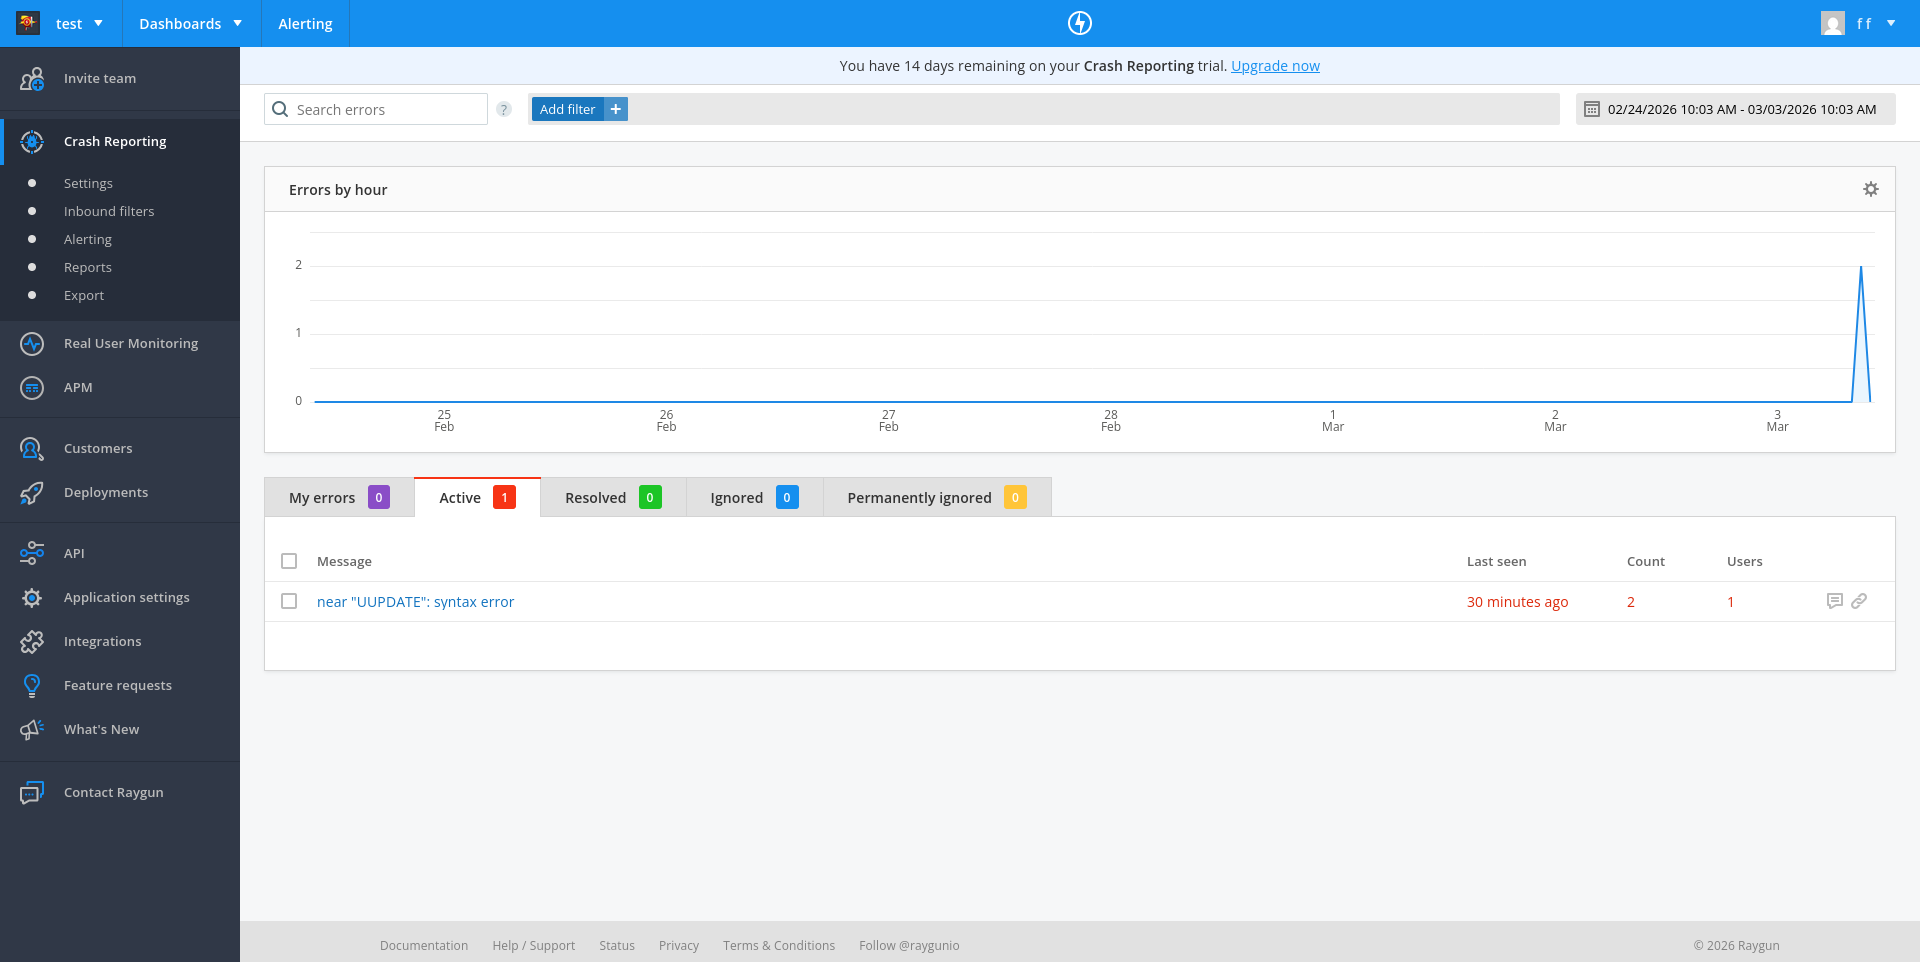
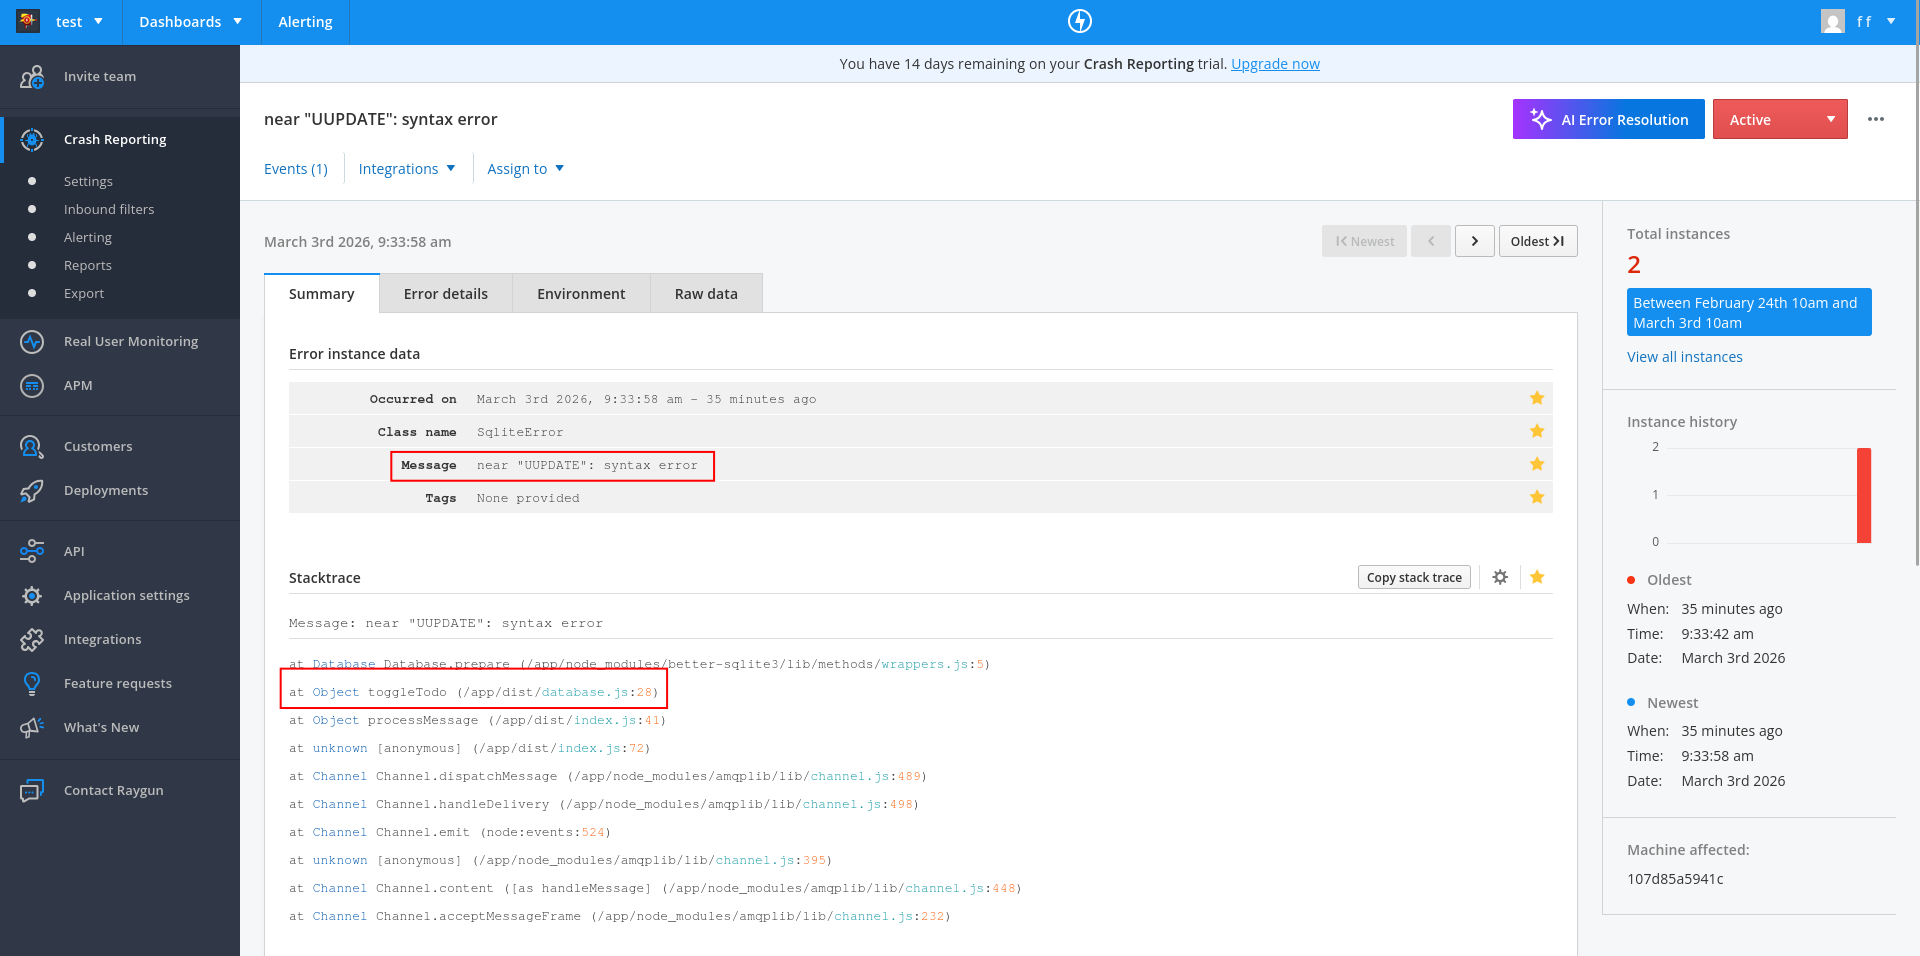
Running the app at this point correctly triggered a crash report to Raygun with the faulty UUPDATE SQL call.
You can see on the dashboard that Raygun has two sections in addition to Crash Reporting: Real User Monitoring and APM (Application Performance Monitoring).
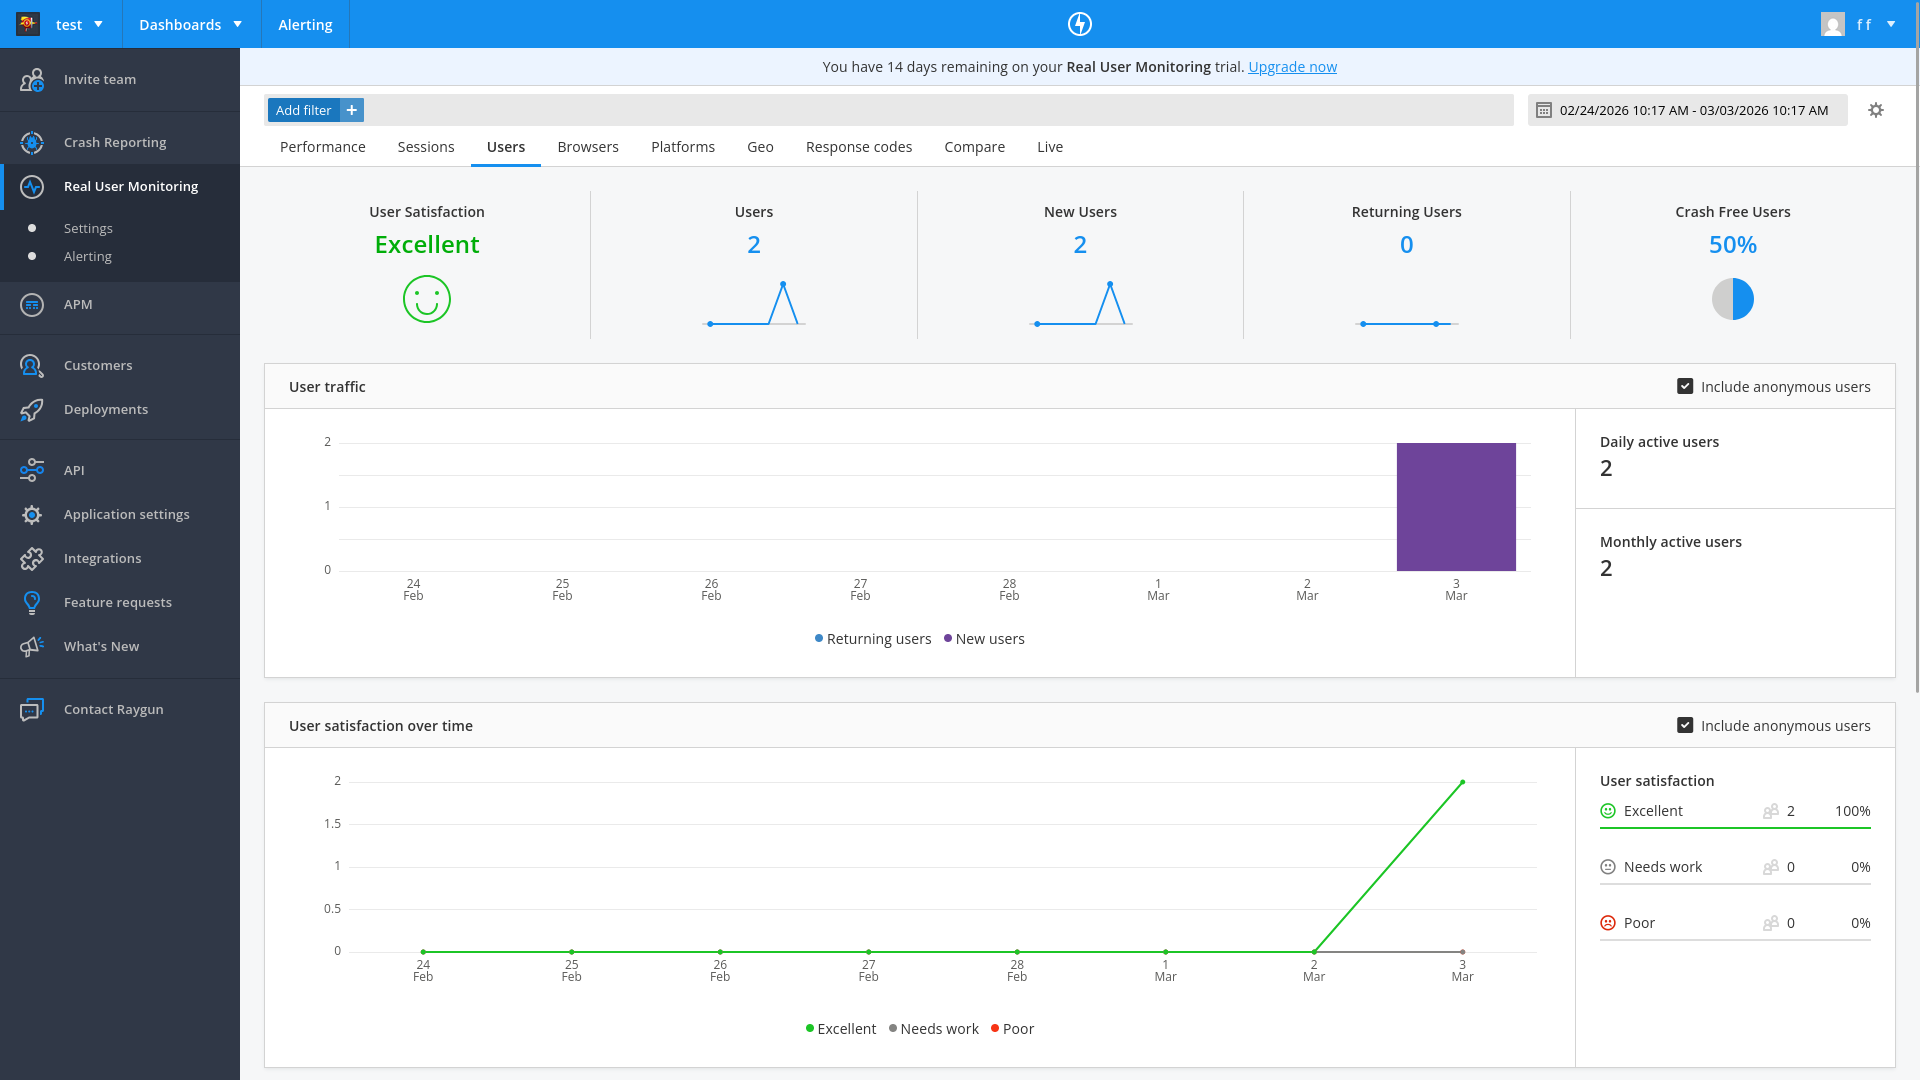
Amp did not add real user monitoring or APM by default. We asked it to add real user monitoring, and it did so easily.
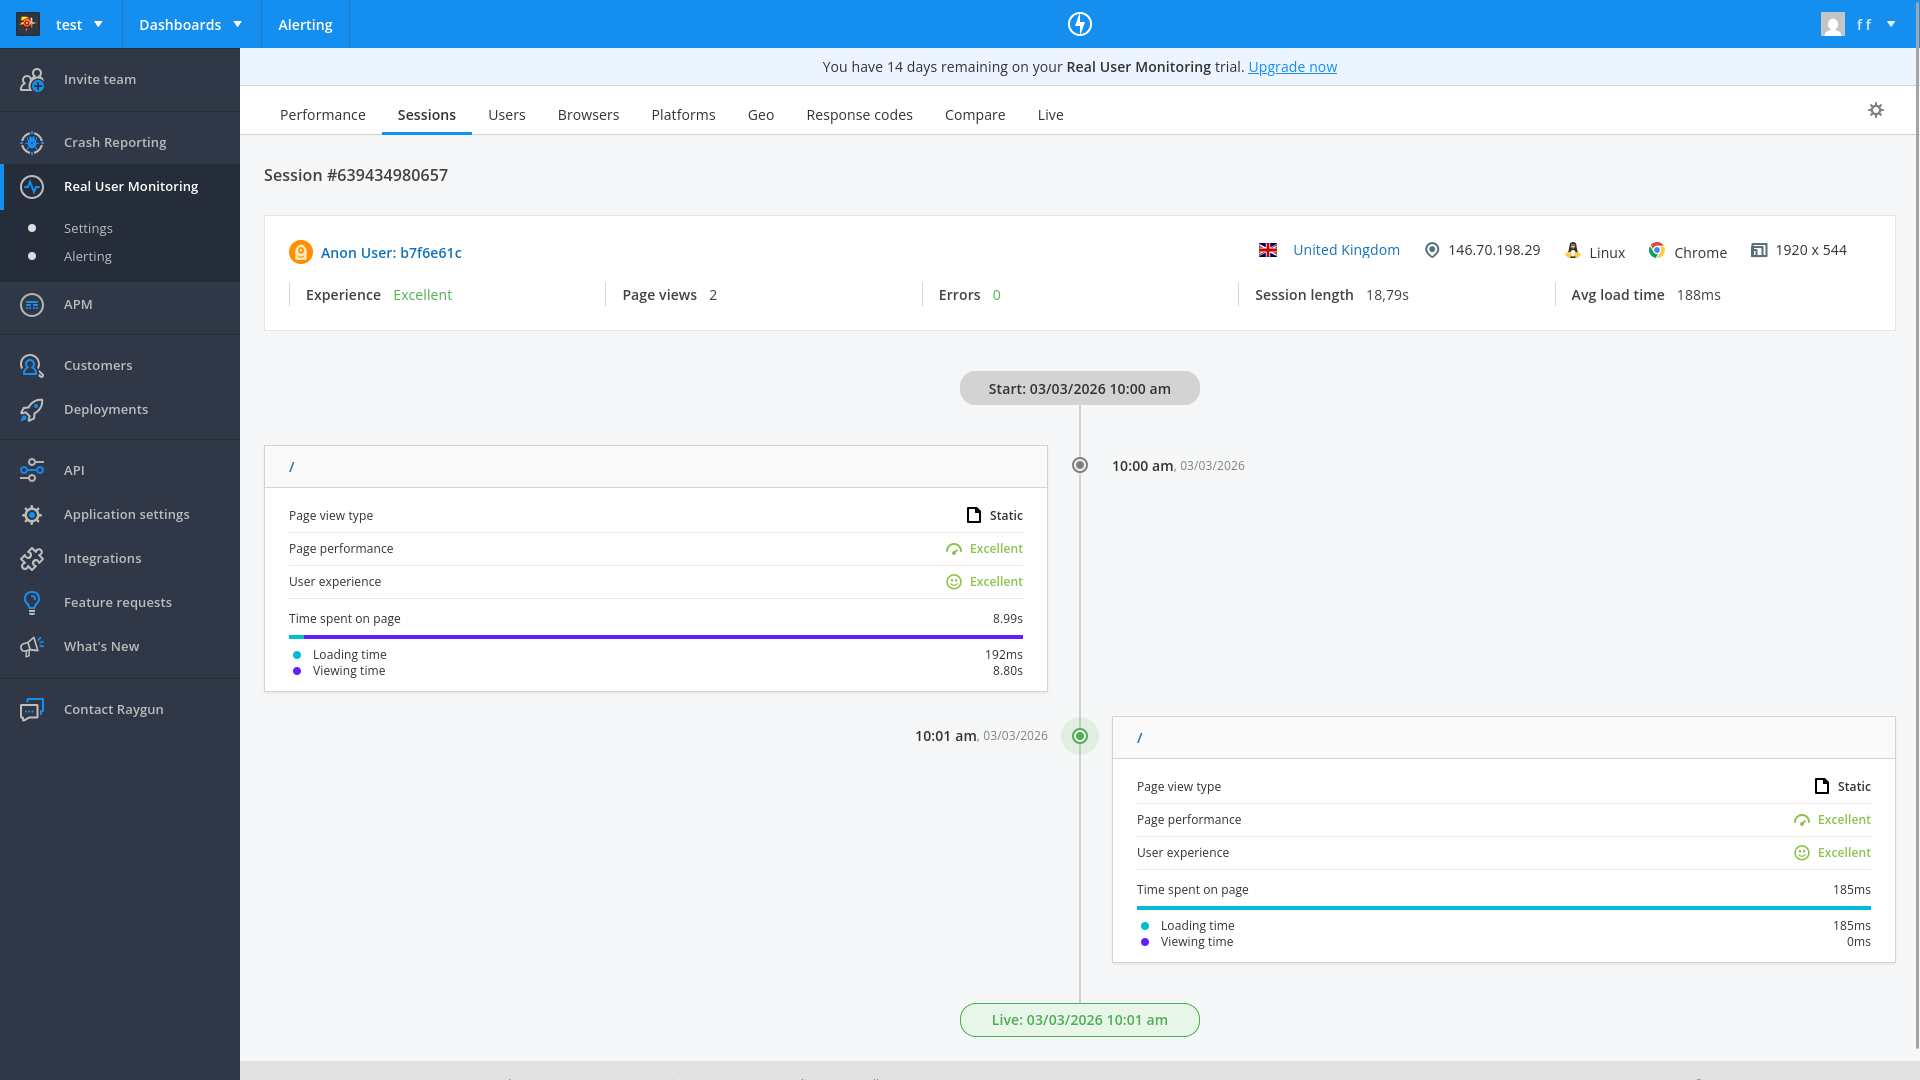
Real user monitoring shows user sessions, the page load time, page errors, country location, and browser type.
The Customers tab also lists all users of the app, and can display for each customer a timeline of how they use your app.
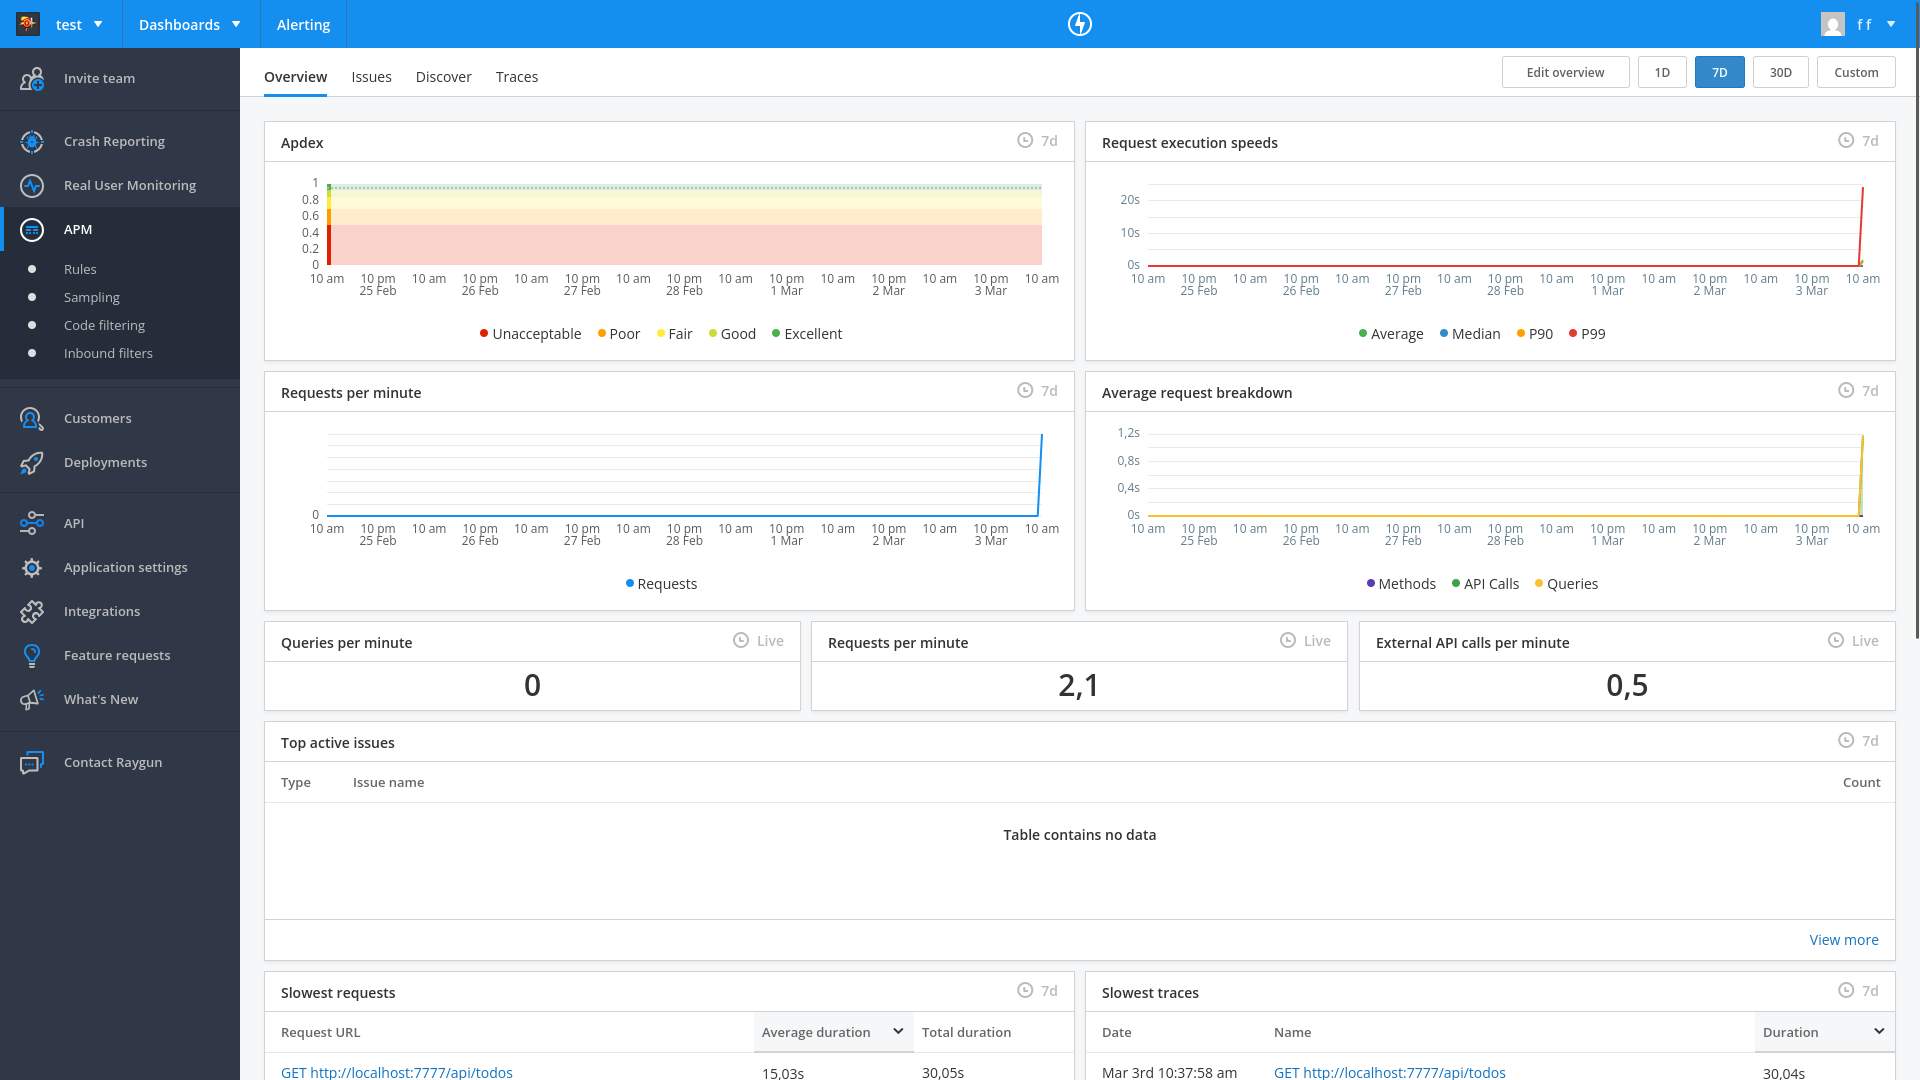
APM uses a separate agent on your server that watches the other components. If any changes deviate from the normal speed of response, it flags the service as having an issue. We asked Amp to add it.
Done. Here's what was added for APM:
- docker-compose.yml — new raygun-agent container (official Raygun APM agent image), with RAYGUN_API_KEY and RAYGUN_AGENT_HOST env vars added to all app containers
- web-server/package.json + sqlite-worker/package.json — added raygun-apm dependency
- web-server/src/index.ts + sqlite-worker/src/index.ts — added import 'raygun-apm/http' as the first import to instrument HTTP requests
The agent collects traces from both Node.js services and forwards them to Raygun. Ready to rebuild.
Trying to run the app now gave pages of errors and npm security warnings. For example:
web2          | npm warn deprecated @npmcli/move-file@2.0.1: This functionality has been moved to @npmcli/fs
web2          | npm warn deprecated inflight@1.0.6: This module is not supported, and leaks memory. Do not use it. Check out lru-cache if you want a good and tested way to coalesce async requests by a key value, which is much more comprehensive and powerful.
web2          | npm warn deprecated gauge@3.0.2: This package is no longer supported.
web2          | npm warn deprecated tar@6.2.1: Old versions of tar are not supported, and contain widely publicized security vulnerabilities, which have been fixed in the current version. Please update. Support for old versions may be purchased (at exorbitant rates) by contacting i@izs.me
sqlite        | Error: Error loading shared library ld-linux-x86-64.so.2: No such file or directory (needed by /app/node_modules/v8-profiler-next/build/binding/Release/node-v115-linux-x64/profiler.node)
web2          | Error: Error loading shared library ld-linux-x86-64.so.2: No such file or directory (needed by /app/node_modules/v8-profiler-next/build/binding/Release/node-v115-linux-x64/profiler.node)
Amp claimed the problem was due to our Docker image:
The raygun-apm package uses native bindings (v8-profiler-next) that require glibc, but Alpine Linux uses musl. Need to switch from node:20-alpine to node:20 (Debian-based).
It also cleared and reinstalled all npm modules.
We now had access to a dashboard that showed any speed deviations for our entire site:
Automated error monitoring with an AI agent
Our final test was to ask Amp to get the latest error from Raygun and fix it.
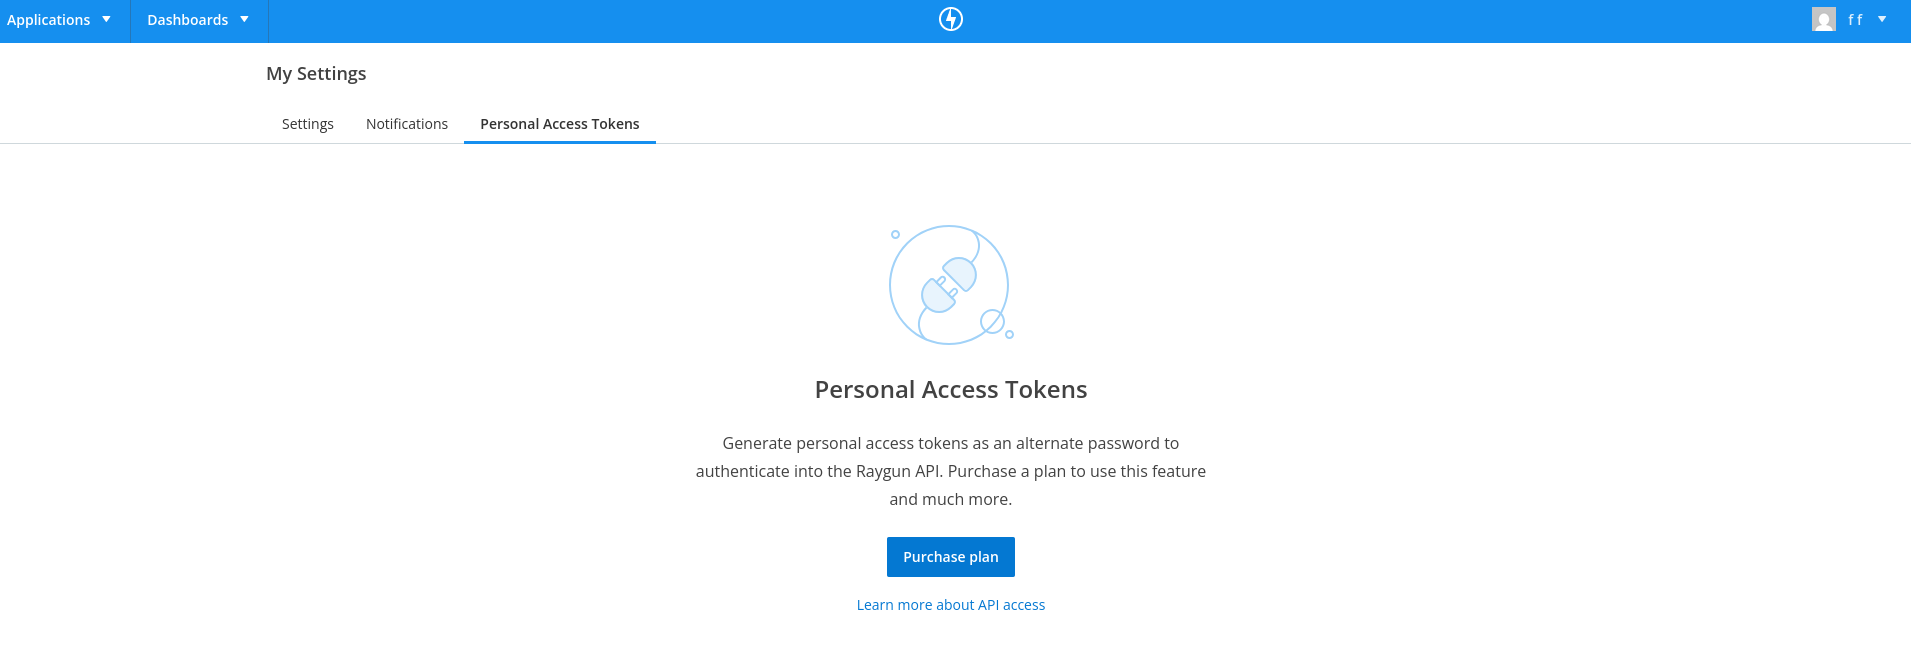
I need a Personal Access Token to use the Raygun API
But access tokens are not available for testing on the Raygun free edition:
How easy was Raygun?
Raygun's registration requires more steps than the other services. The free trial lacks the ability for automated error retrieval and fixing.
Amp needed a fair amount of additional prompts to configure all aspects of monitoring. But although there were many errors, the system eventually worked completely, without manual research and fixing.
Raygun successfully caught and displayed the underlying cause of the SQL error.
The APM dashboard is useful to intelligently monitor speed deviations. It looked like the APM calls themselves took a fair amount of time, which might be worth monitoring if page speed is a priority. The npm audit warnings in the downloaded monitoring agent are worth reviewing before going to production.
The customer dashboard looked very useful for marketing — with its ability to separate and view a customer's browsing history and errors.
Integrating TrackJS
The last online error tracking service we evaluated was TrackJS.
Automated registration
Agent-driven registration? As with the other services, no:
The signup form uses Google reCAPTCHA, which I cannot bypass programmatically.
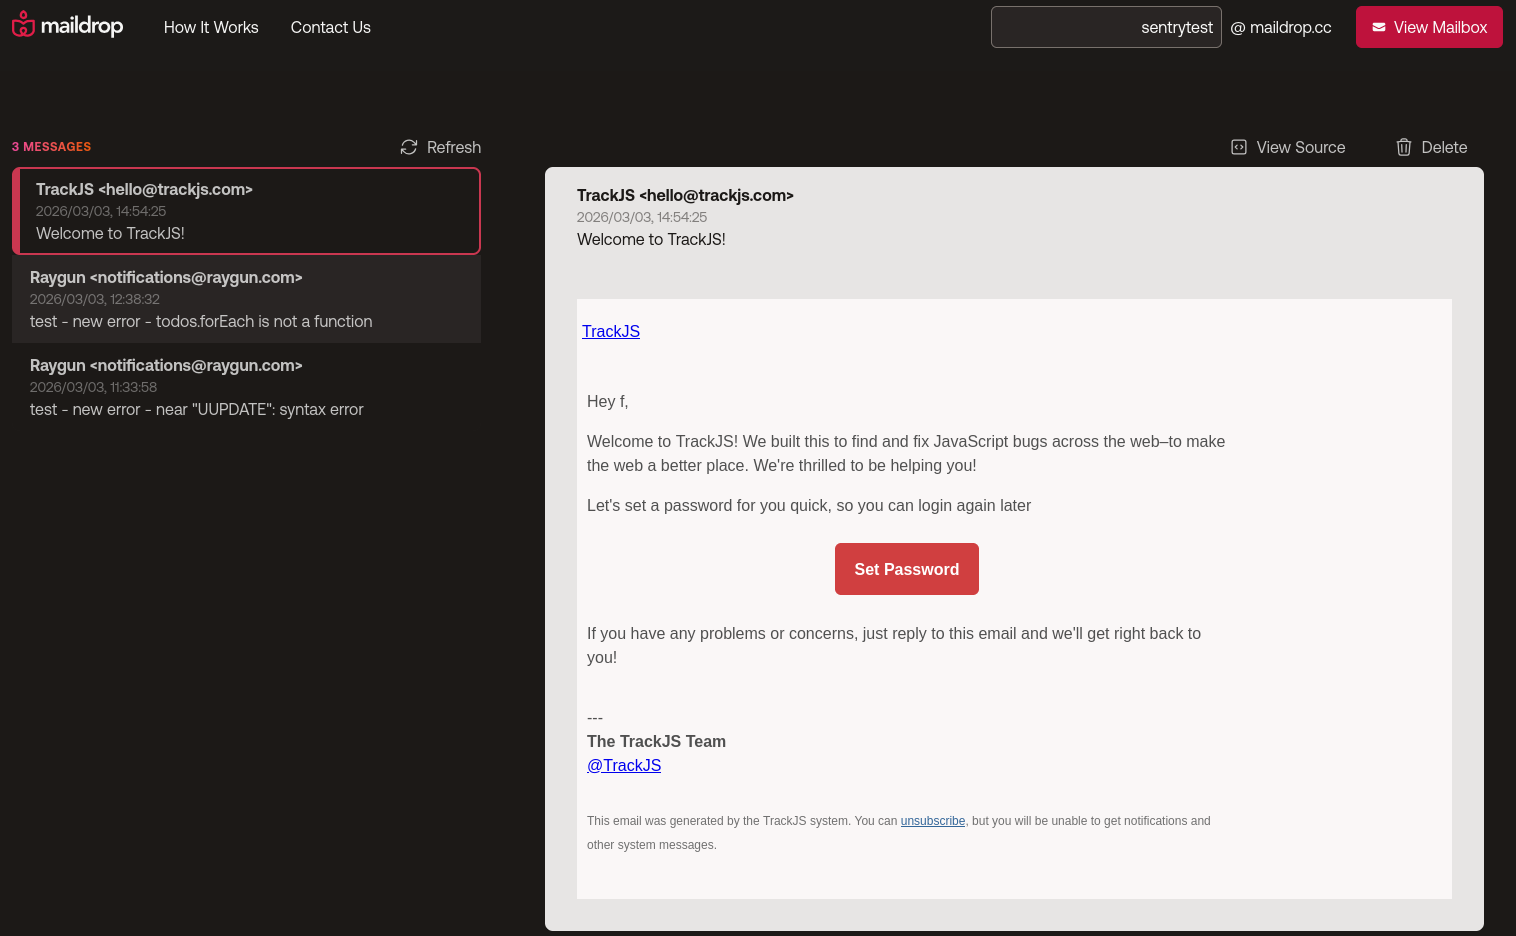
TrackJS has a very smooth manual registration experience, however. While it requested our name and company name, it didn't ask for email confirmation, CAPTCHA, or even a password. No thinking was required to test their product.
TrackJS sends an email that you can use later to set a password if you want to continue using their service on another computer after registration.
Configuring monitoring
Amp integrated TrackJS monitoring into the Todo application quickly, as with both other services.
However, the localhost workaround for Brave blocking scripts and calls to TrackJS took a lot longer than with the other services. We encountered a few errors in the app and needed Amp to retry fixing the routing.
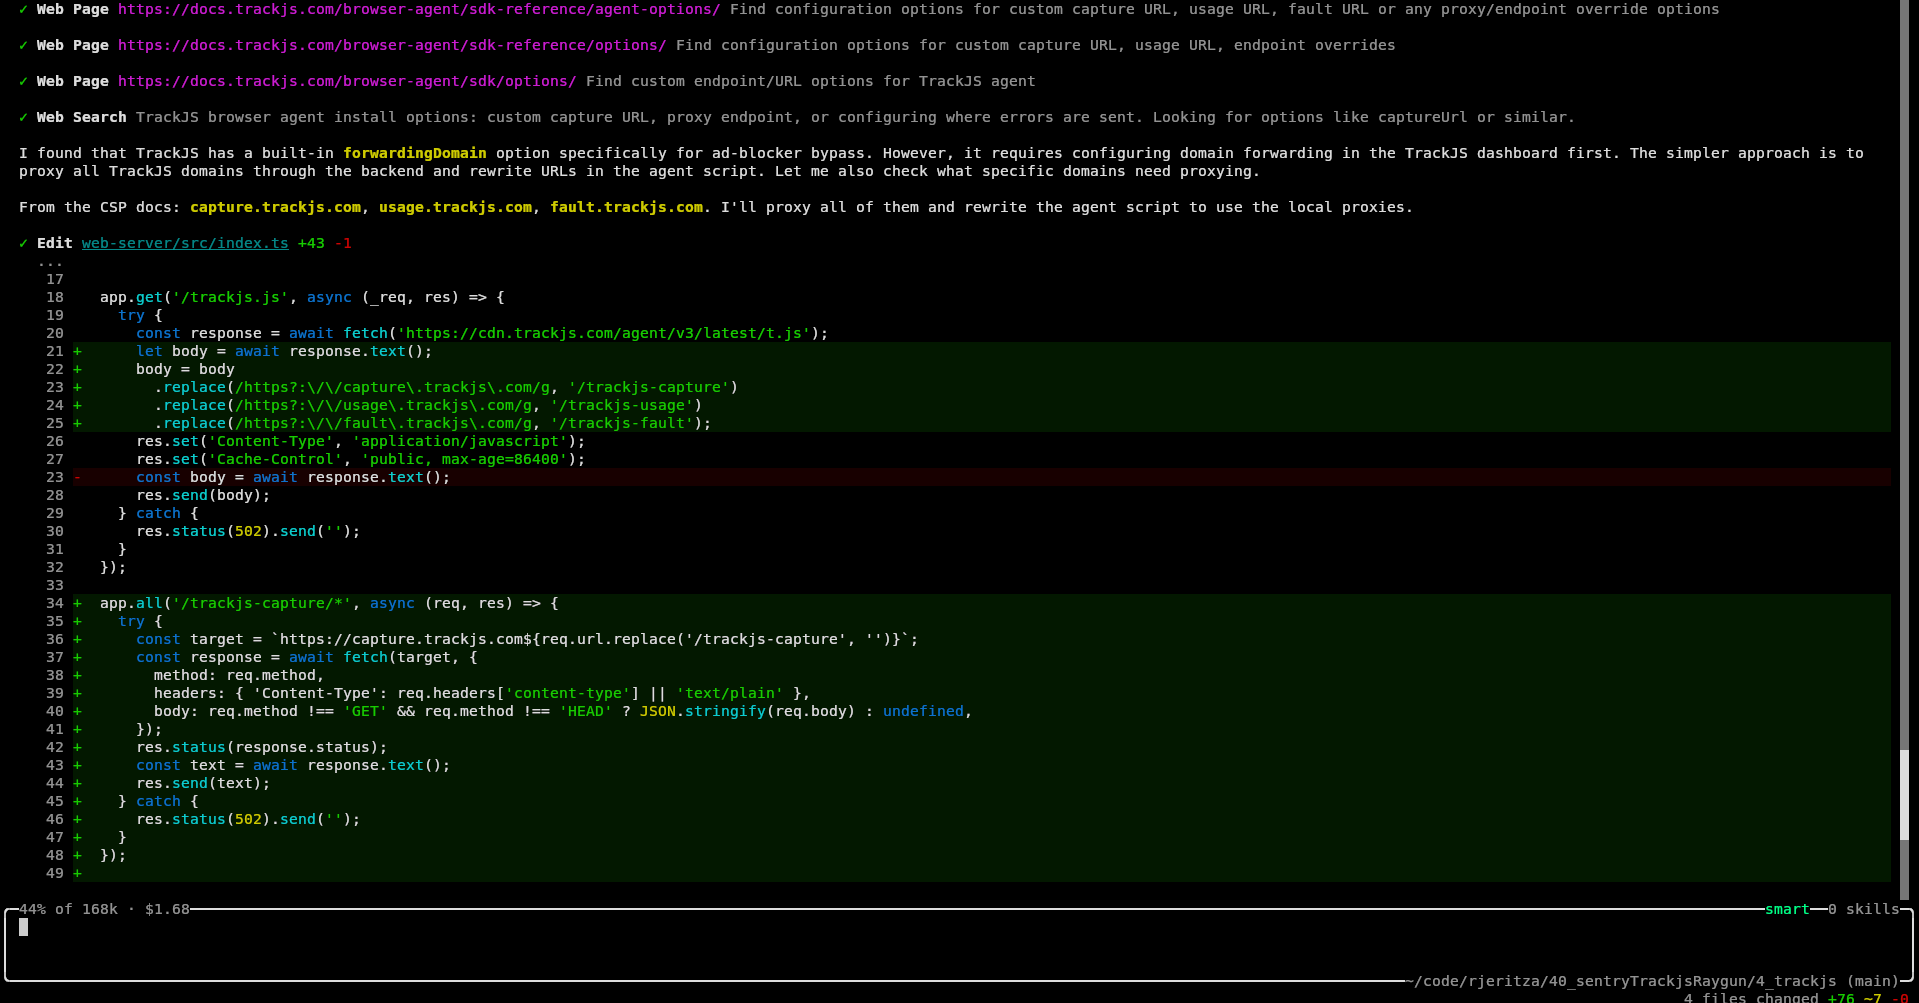
Amp informed us TrackJS actually provides its own workaround for ad-blockers, but sadly that needs a custom domain name, which we didn't have during our local test.
Eventually, Amp had to use regular expressions to replace calls that the TrackJS JavaScript made to its domain with localhost. But even after the site loaded successfully, errors weren't arriving on the TrackJS website.
Amp said:
The issue was that the TrackJS agent sends error payloads as text/plain, which express.json() ignores — so req.body was undefined and nothing was forwarded. Now the capture route uses express.text() to parse the raw body and forwards it correctly.
After this final fix, the error appeared.
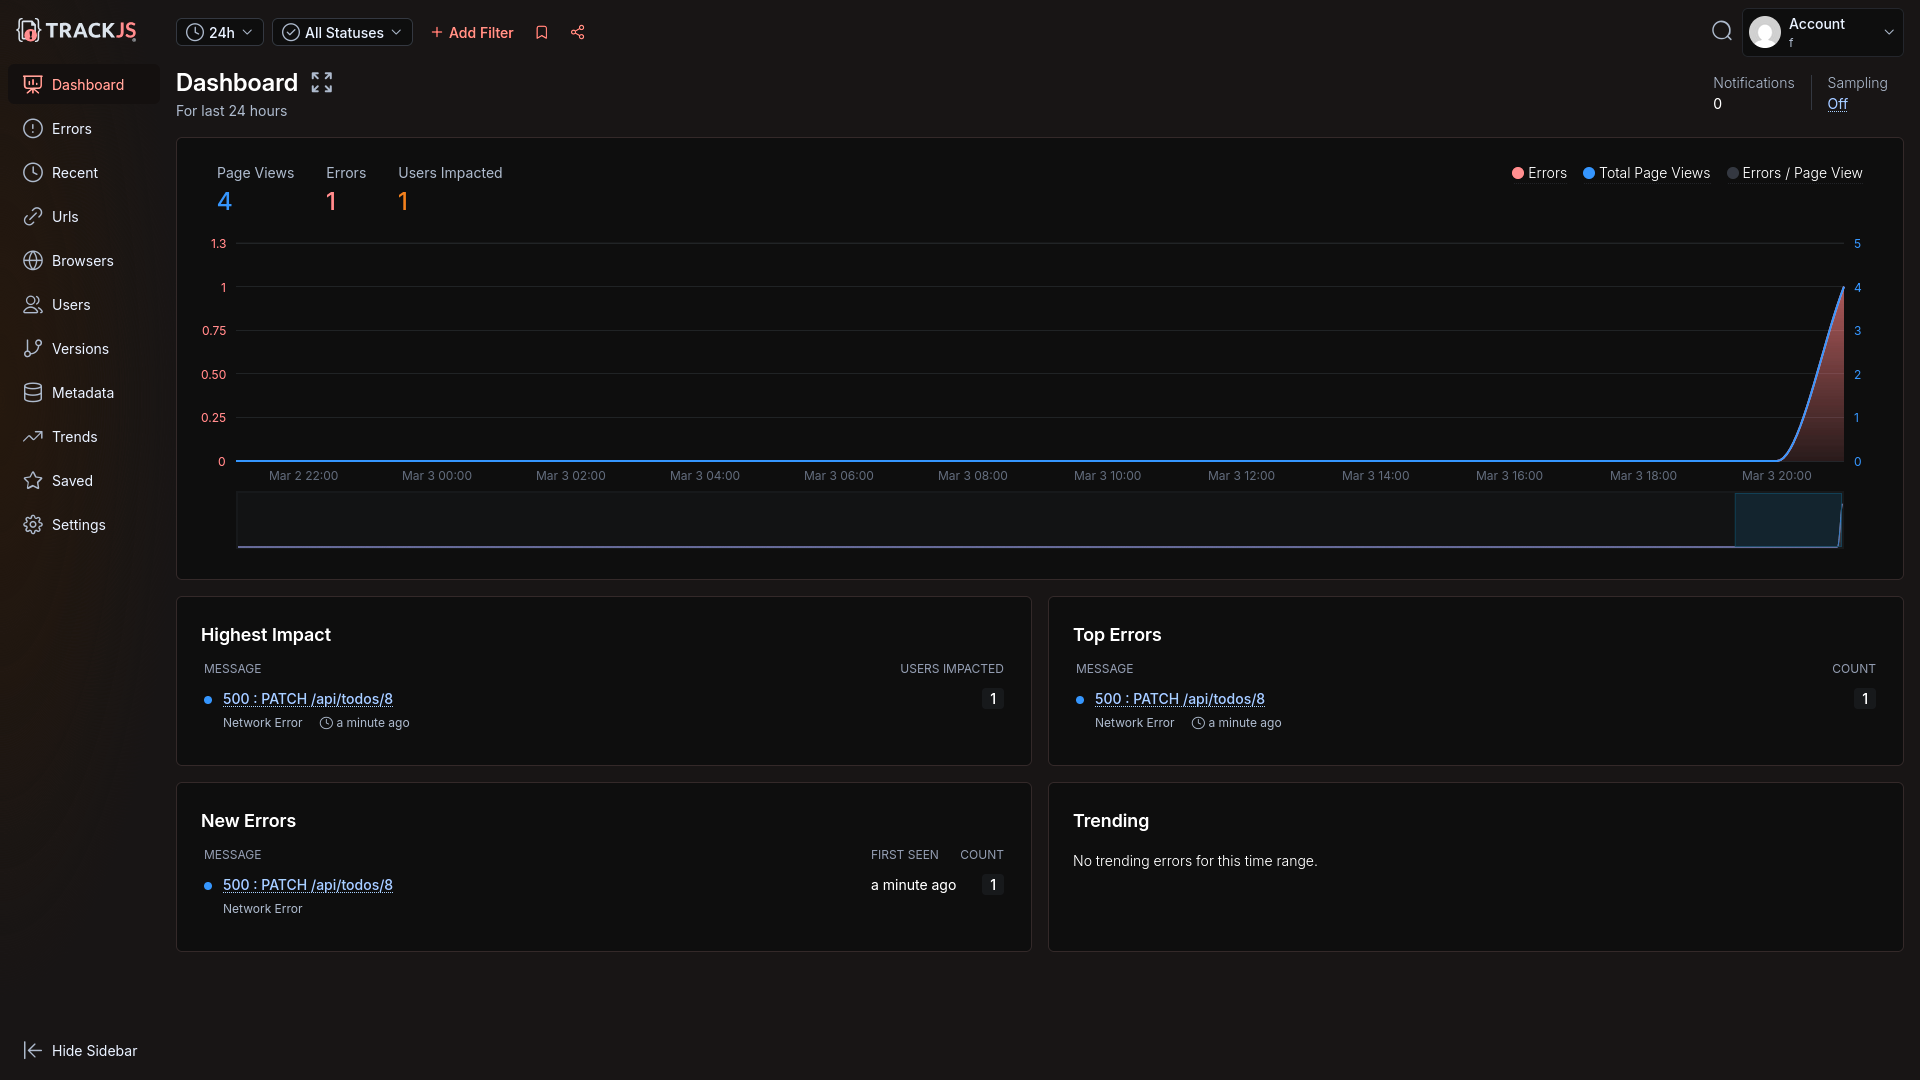
However, the underlying SQL wasn't shown, nor any server information for the frontend error.
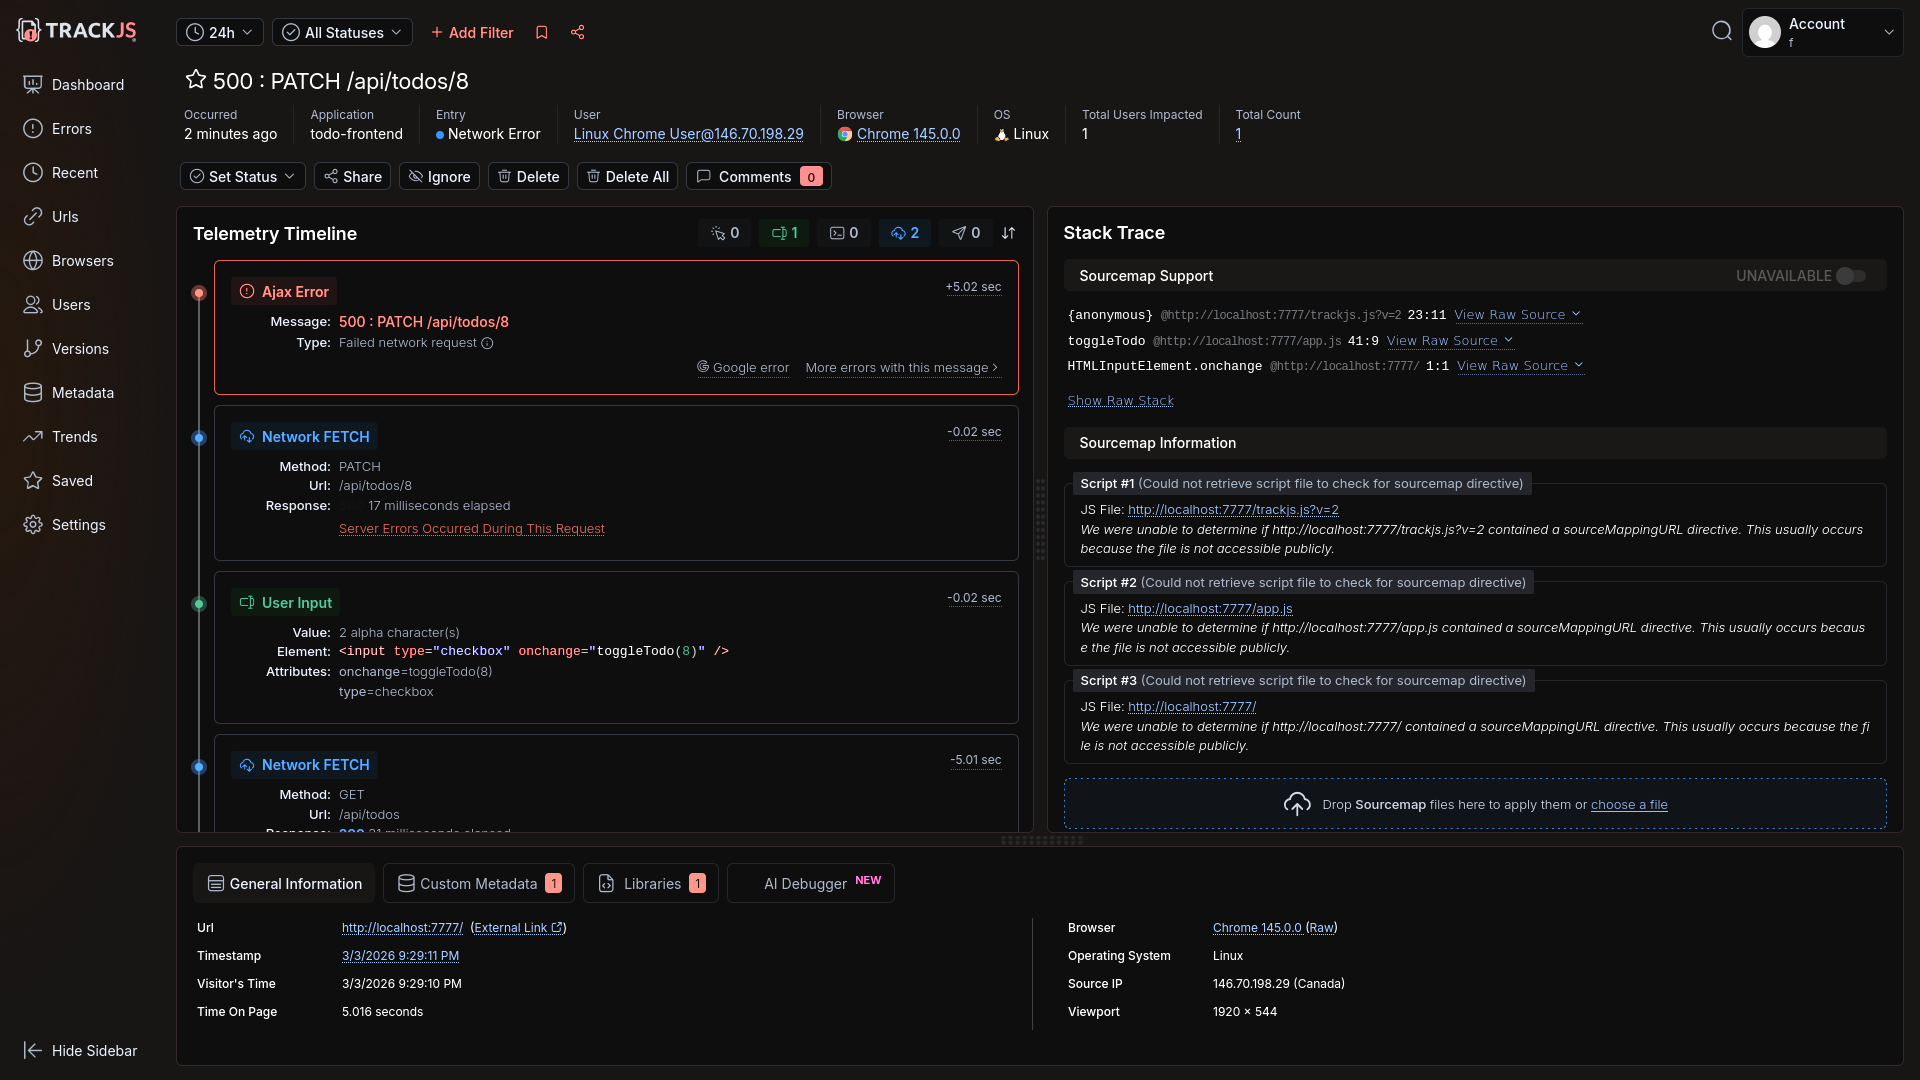
Amp manually added server error sending code, but still no error was sent:
catch (err) {
  TrackJS.track(err instanceof Error ? err : new Error('Failed to fetch todos'));
Amp then said server errors might not be possible
Now, regarding the actual problem — TrackJS does not natively merge browser and server error details into a single trace. The browser and server are separate error entries linked only by correlation ID. That's a TrackJS platform limitation, not something configurable.
However, I should be honest with you: TrackJS is fundamentally a browser-focused error monitoring tool. Its Node.js agent reports server errors separately, and the correlation feature just links them loosely in the dashboard. There's no unified distributed trace view like you'd get with Sentry or Datadog.
We disagreed and demanded it add server error tracking, so Amp went into full debugging mode — manually running curl, testing API calls through temporary Node.js scripts, and reading the calls in the TrackJS npm module itself.
Eventually it found it had not set the API key in the code correctly as it expected an environment variable. A very human error!
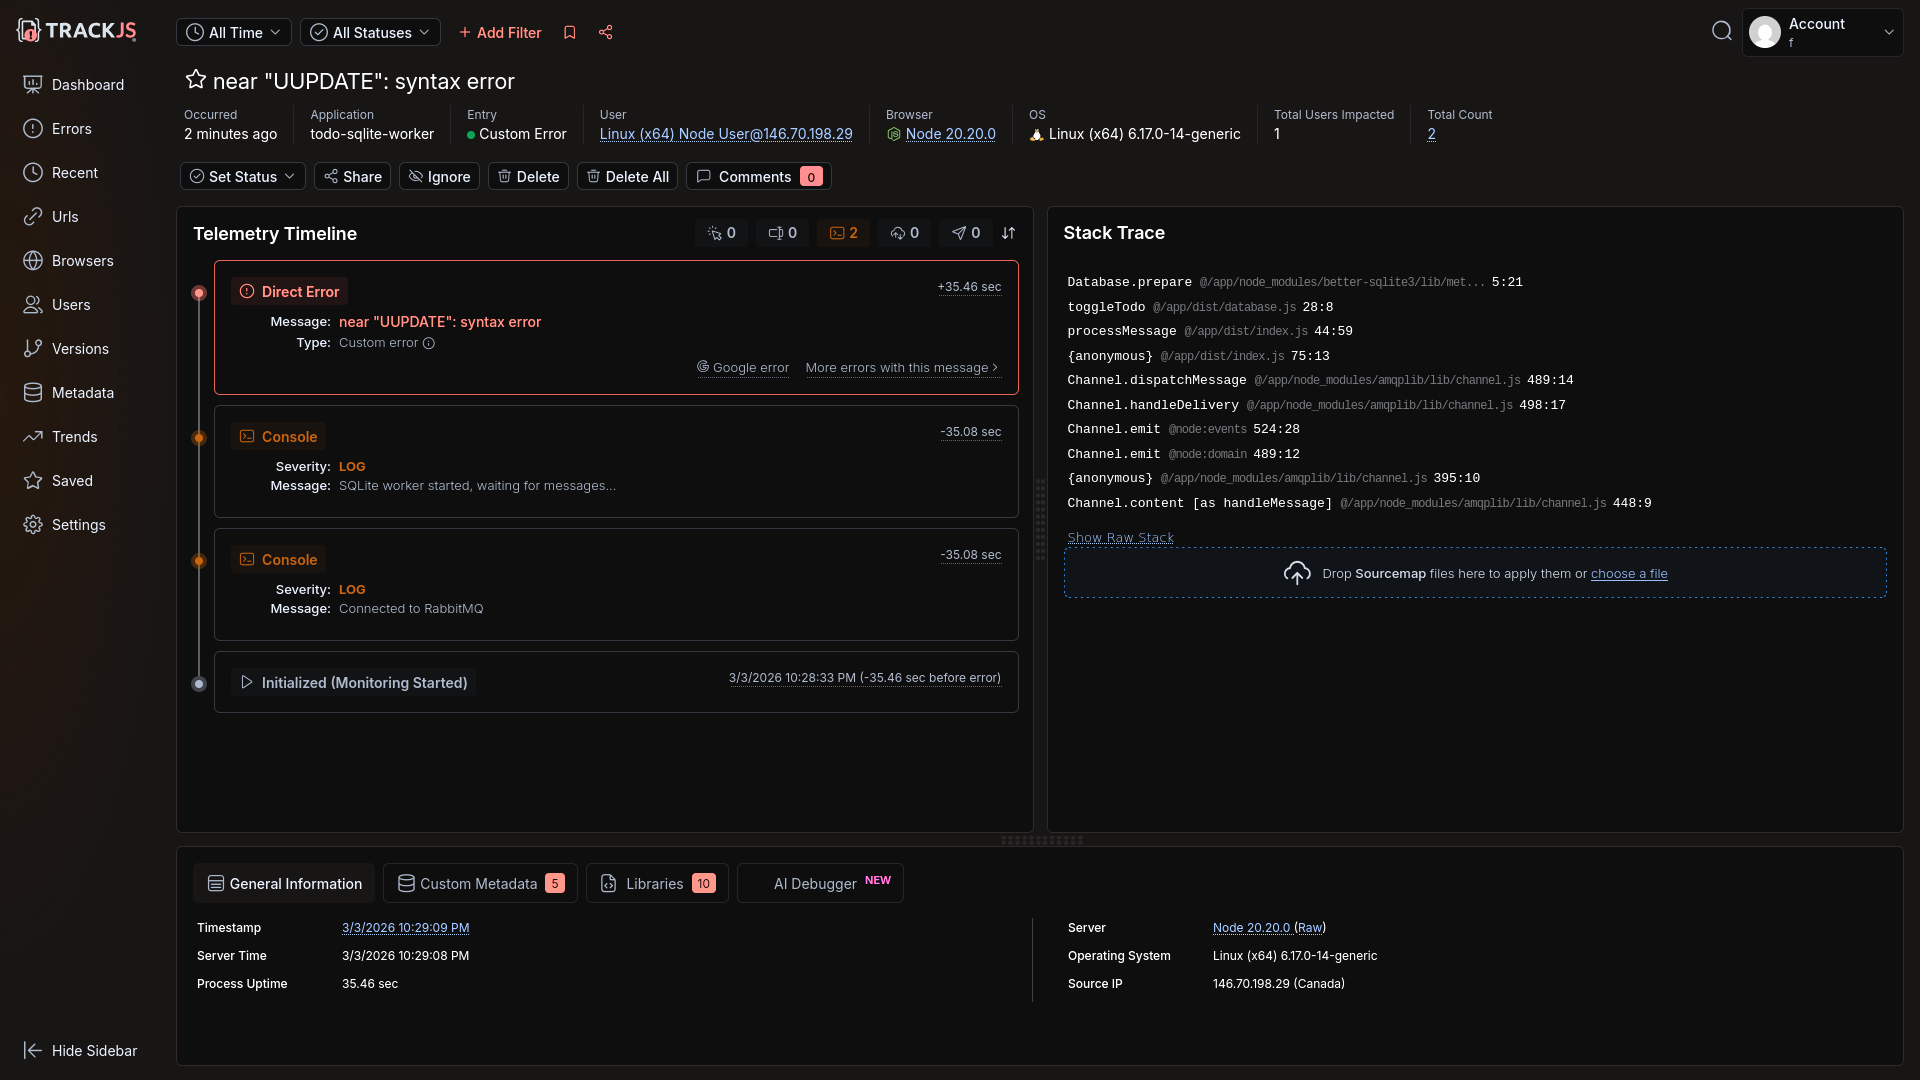
Once this typo was resolved, the server error arrived, but it was not linked to the frontend through an end-to-end trace.
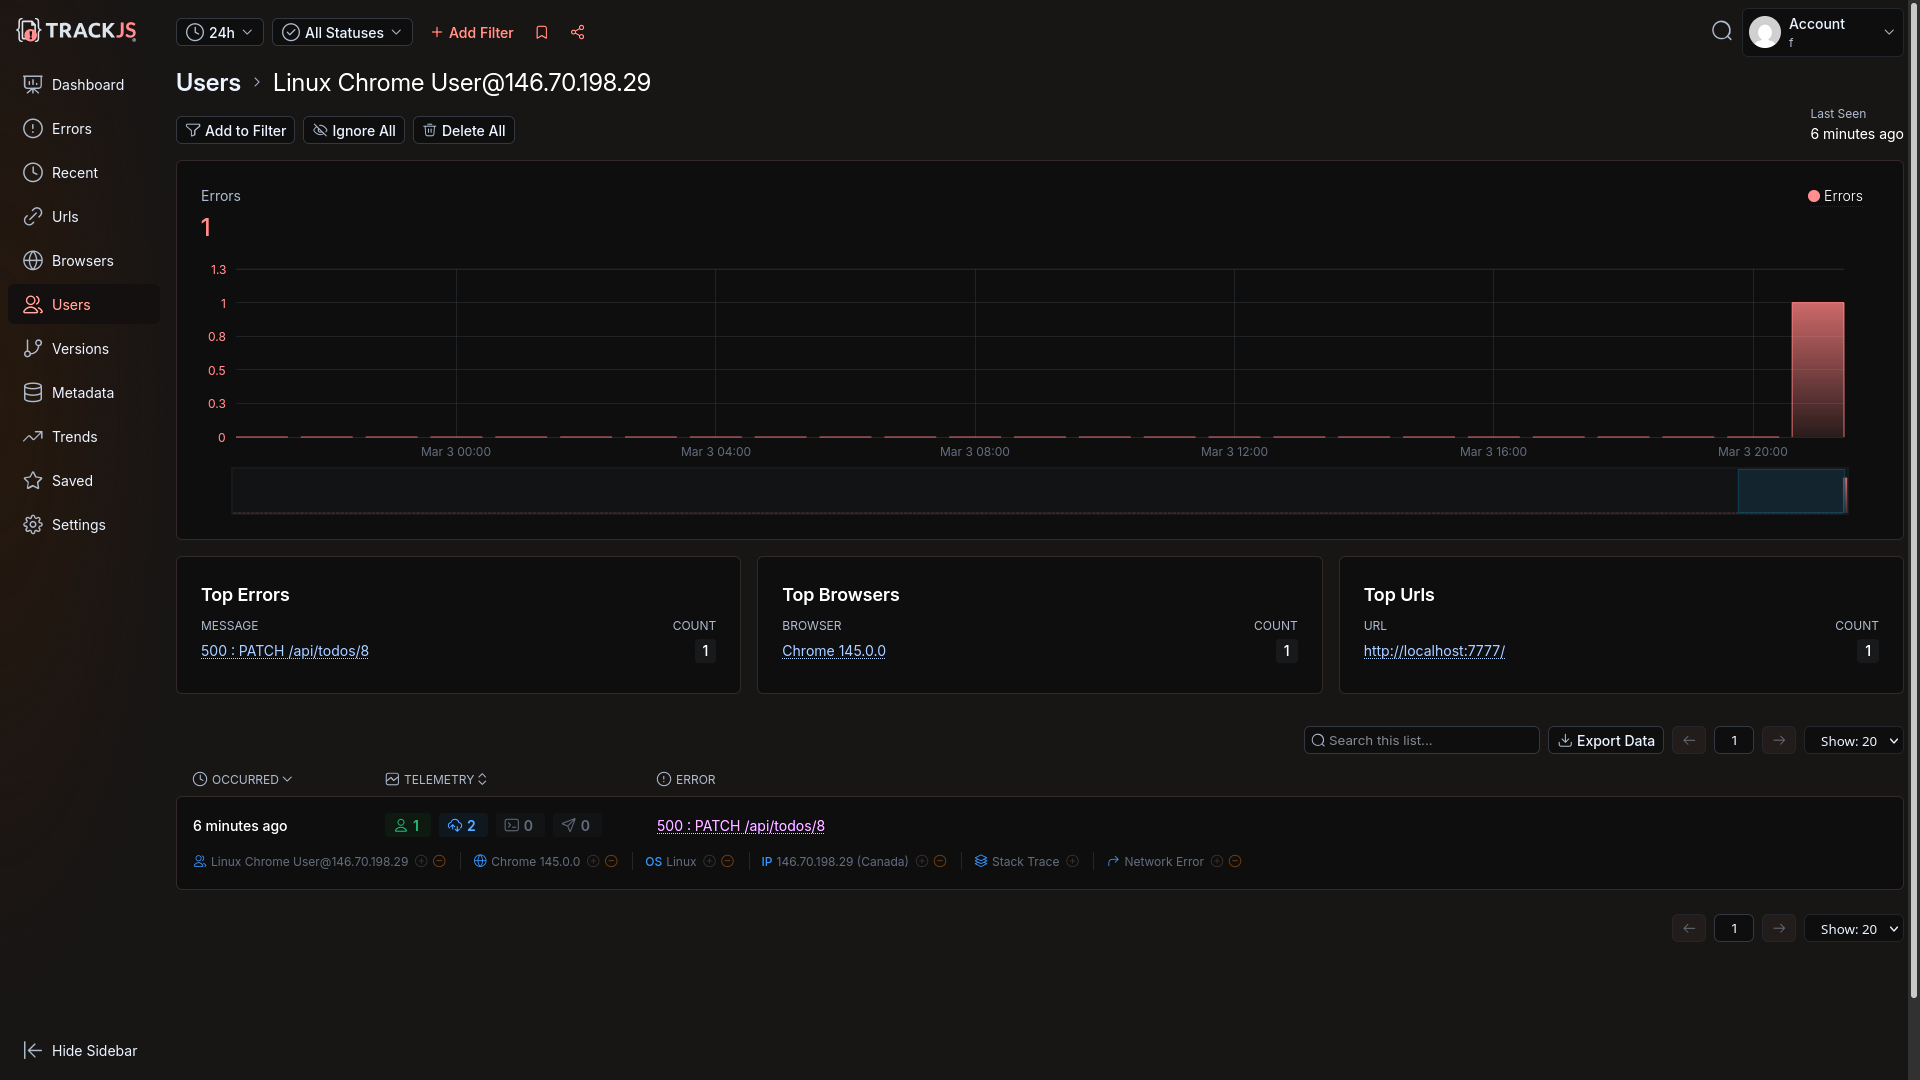
TrackJS has a customer list, similar to Raygun, but not as comprehensive.
Automated error monitoring with an AI agent
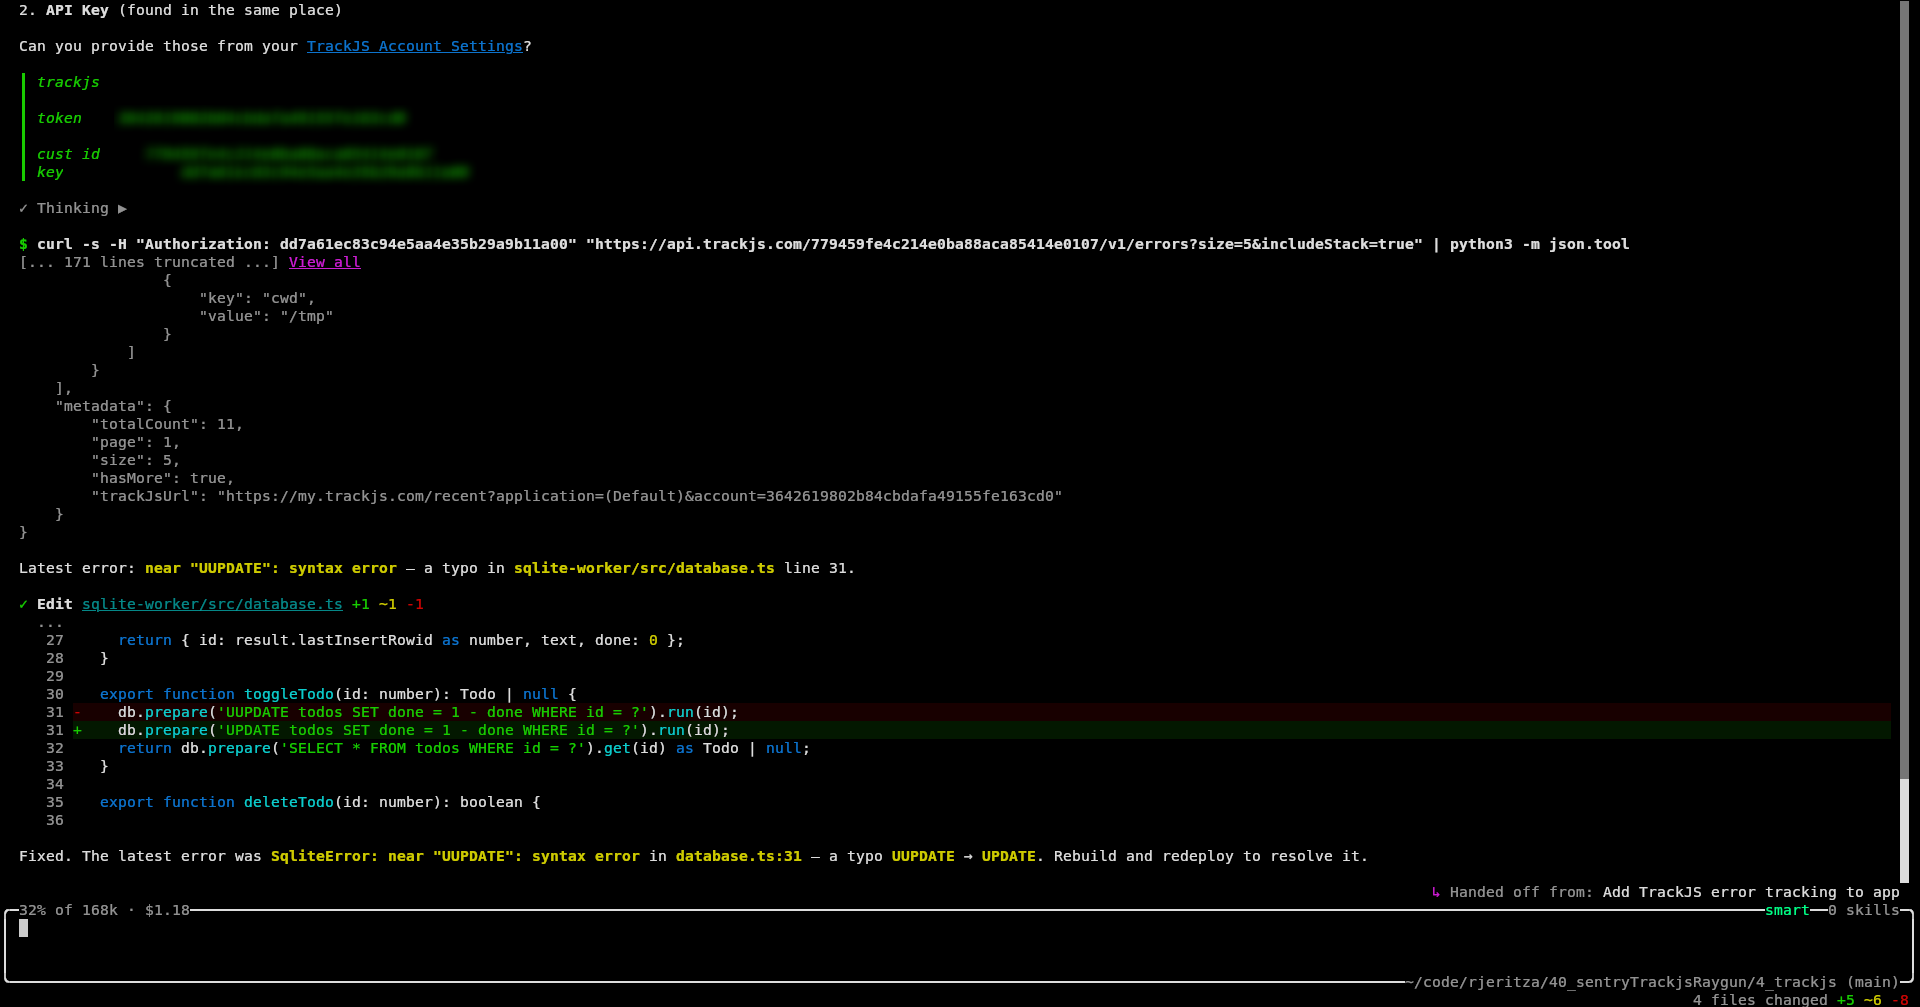
Our request for Amp to find and fix the last error shown in TrackJS was successful. All Amp needed was a customer Id and API key to sign in (which is different to the token used to log errors).
Amp downloaded and fixed the error.
How easy was TrackJS?
TrackJS has enjoyably smooth registration.
As long as your business has a domain, TrackJS also includes a way to circumvent browser ad-blockers. Without the public URL however, the agent struggled for a while to successfully set up error tracking and call rerouting.
A lack of end-to-end traces, to link the frontend Todo toggling error with the backend SQL syntax error, is a big limitation over other monitoring services. TrackJS is designed almost exclusively for the frontend. For the backend it has only a Node.js integration.
Automated agent login for error retrieval and fixing was quick and easy.
Integrating Sentry self-hosted
Our final test was not of an online service, but of the free Sentry self-hosted edition.
While Sentry is open-source, it takes a hands-off approach to self-hosting. Here's what the documentation says:
This version comes with no guarantees or dedicated support. These are the minimum requirements:
- 4 CPU Cores
- 16 GB RAM + 16 GB swap
- 20 GB Free Disk Space
Those resources are hefty and need a powerful server.
Configuring monitoring
First, we asked Amp to review the install.sh script in the Sentry self-hosted repository, which runs everything in Docker containers.
Security Review: Self-Hosted Sentry install.sh
✅ Good news: Everything is Docker-contained. The script does not install packages on your host, modify system files, or touch anything outside its own directory (with one exception below).
Amp downloaded and configured it. We then manually started Sentry:
cd sentry-self-hosted
./install.sh --no-report-self-hosted-issues --skip-user-creation


# install failed partially. run manually:
docker pull confluentinc/cp-kafka:7.6.6
./install.sh --no-report-self-hosted-issues --skip-user-creation

docker compose run --rm web createuser
docker compose up --wait
Sentry took several minutes to start, and used 100% of our virtual machine's four CPUs. The Docker setup is complicated, using 70 separate containers.
However, the site worked correctly, and we could register.
We gave Amp our email address and password to set up project itself. Success.
As always, Brave blocked calls to Sentry, and Amp fixed it by rerouting the calls locally.
Our error arrived on the dashboard.
Automated error monitoring with an AI agent
Finally, we asked Amp to pull the latest unresolved error from Sentry and fix it. This time, Amp didn't have a key, but created one itself using the email and password we gave it.
How easy was Sentry self-hosted?
Sentry self-hosted is easy to configure, run, and use with an AI agent. Everything worked the first time.
However, Sentry self-hosted has significant resource requirements, no official support, and the complexity of 70 interconnected containers.
For smaller servers, you can consider SigNoz self-hosted as an alternative, which we evaluated in a previous article.
Which tool is best: Sentry, Raygun, or TrackJS?
Sentry was the clear winner in this evaluation for AX and ease of automation. LLMs are familiar with it, can configure and integrate it easily, and are able to monitor and correct errors automatically. The only consideration here should be cost. As most monitoring services have similar features at a high level, you should compare the current fees to see if any service is substantially cheaper while still meeting your needs.
Sentry self-hosted is complex, has no official support, and requires a lot of computing resources. Sentry run locally also won't give you access to its AI bug-fixing tool, which is closed-source and available online only. For a self-hosted option you might want to consider SignNoz instead, or an open-source OpenTelemetry option.
All the services we evaluated accepted a disposable email account. Sentry required no additional information at registration, and TrackJS didn't even require a password.
All the services needed a workaround for ad-blockers in the browser, and the AI told us only TrackJS has a native solution to the problem. Some manual research reveals that Sentry and Raygun have their own workarounds to ad-blockers.
Raygun's free trial lacks the ability for automated error retrieval and fixing. Its APM dashboard for speed anomalies seems useful, as does its comprehensive customer tracking.
TrackJS lacks end-to-end traces and is more a frontend tool than full-stack — unless you're using only Node.js on the backend. If full-stack observability is a priority, you may want to evaluate whether TrackJS meets your needs alongside a dedicated backend monitoring solution.
If you want to use the power of AI agents to add error tracking (and automated error correction) to your app, here are some tips before you start:
- Be careful of hidden biases the agent can have from context — even folder names.
- An agent cannot register for an account, but can use the website for all other setup work once an account exists.
- You'll need to configure rerouting of browser requests through your server to avoid ad-blockers built into modern web browsers
- Always run your agent in a virtual machine or in Docker to keep it in a secure sandbox. Even if you trust the agent itself not to perform a harmful action on your computer, it can be tricked by malicious documentation and modules to run harmful code — accessing and editing any file on your system.
- Validate each commit, being careful that the agent doesn't commit any secrets to configuration files instead of to
.env(which should not be saved to Git). - Check the service documentation and dashboard yourself to see if the AI has configured all features a service offers. The agent will probably configure only the most common integrations by default.